11. Explore MEROPS profile
Source:vignettes/11_Explore_merops_profile.Rmd
11_Explore_merops_profile.RmdHow to explore the MEROPS profile?
First, make sure the library is loaded
Now let’s load the MEROPS profile:
merops_profile_T <- read_merops(merops_path = "../inst/extdata/MEROPS", profile = T, write = F )
head(merops_profile_T)| MEROPS_family | domain_name | 5mSIPHEX1_0 | 5mSIPHEX1_1 | 5mSIPHEX1_10 | 5mSIPHEX1_11 | 5mSIPHEX1_13 | 5mSIPHEX1_15 | 5mSIPHEX1_18 | 5mSIPHEX1_19 | 5mSIPHEX1_2 | 5mSIPHEX1_25 | 5mSIPHEX1_26 | 5mSIPHEX1_32 | 5mSIPHEX1_33 | 5mSIPHEX1_37 | 5mSIPHEX1_8 | 5mSIPHEX1_9 | 5mSIPHEX2_10 | 5mSIPHEX2_14 | 5mSIPHEX2_16 | 5mSIPHEX2_18 | 5mSIPHEX2_25 | 5mSIPHEX2_3 | 5mSIPHEX2_5 | 5mSIPHEX2_7 | 700mSIPHEX1_0 | 700mSIPHEX1_1 | 700mSIPHEX1_12 | 700mSIPHEX1_15 | 700mSIPHEX1_17 | 700mSIPHEX1_18 | 700mSIPHEX1_2 | 700mSIPHEX1_20 | 700mSIPHEX1_3 | 700mSIPHEX1_8 | 700mSIPHEX2_13 | 700mSIPHEX2_14 | 700mSIPHEX2_16 | 700mSIPHEX2_21 | 700mSIPHEX2_22 | 700mSIPHEX2_23 | 700mSIPHEX2_24 | 700mSIPHEX2_9 |
|---|---|---|---|---|---|---|---|---|---|---|---|---|---|---|---|---|---|---|---|---|---|---|---|---|---|---|---|---|---|---|---|---|---|---|---|---|---|---|---|---|---|---|---|
| MER0000510 | ClpA ATP-ase component of endopeptidase Clp | X20.001 | 1 | 1 | 0 | 0 | 1 | 0 | 0 | 0 | 0 | 0 | 0 | 0 | 0 | 1 | 1 | 0 | 1 | 0 | 0 | 0 | 1 | 1 | 0 | 1 | 1 | 1 | 0 | 0 | 0 | 0 | 0 | 0 | 0 | 1 | 1 | 0 | 0 | 0 | 0 | 0 | 0 | 1 |
| MER0011344 | family C26 unassigned peptidases | C26.UPW | 1 | 0 | 0 | 0 | 0 | 0 | 0 | 0 | 0 | 0 | 0 | 0 | 0 | 1 | 1 | 0 | 1 | 0 | 0 | 0 | 1 | 1 | 0 | 0 | 0 | 0 | 0 | 0 | 0 | 0 | 0 | 0 | 0 | 1 | 1 | 0 | 0 | 0 | 0 | 0 | 0 | 0 |
| MER0015597 | amidophosphoribosyltransferase precursor | C44.001 | 1 | 1 | 0 | 0 | 1 | 0 | 0 | 0 | 0 | 0 | 0 | 0 | 0 | 0 | 1 | 0 | 1 | 0 | 0 | 0 | 1 | 0 | 0 | 1 | 1 | 0 | 0 | 0 | 0 | 0 | 0 | 0 | 0 | 0 | 0 | 0 | 0 | 0 | 0 | 0 | 0 | 0 |
| MER0020519 | TldD peptidase | M103.001 | 1 | 0 | 0 | 0 | 0 | 0 | 0 | 0 | 0 | 0 | 0 | 0 | 0 | 0 | 0 | 0 | 1 | 0 | 0 | 0 | 0 | 0 | 0 | 0 | 0 | 0 | 0 | 0 | 0 | 0 | 0 | 0 | 0 | 0 | 0 | 0 | 0 | 0 | 0 | 0 | 0 | 0 |
| MER0024566 | amidophosphoribosyltransferase precursor | C44.001 | 1 | 1 | 0 | 0 | 1 | 0 | 0 | 0 | 0 | 0 | 0 | 0 | 0 | 0 | 1 | 0 | 1 | 0 | 0 | 0 | 1 | 0 | 0 | 1 | 1 | 1 | 0 | 0 | 0 | 0 | 0 | 0 | 0 | 0 | 0 | 0 | 0 | 0 | 0 | 0 | 0 | 1 |
| MER0024582 | methionyl aminopeptidase 1 | M24.001 | 1 | 0 | 0 | 0 | 0 | 0 | 0 | 0 | 0 | 0 | 0 | 0 | 0 | 0 | 0 | 0 | 1 | 0 | 0 | 0 | 0 | 0 | 0 | 0 | 1 | 0 | 0 | 0 | 0 | 0 | 0 | 0 | 0 | 0 | 0 | 0 | 0 | 0 | 0 | 0 | 0 | 0 |
| MER0025778 | GMP synthase | C26.957 | 1 | 1 | 0 | 0 | 1 | 0 | 0 | 0 | 0 | 0 | 0 | 0 | 0 | 1 | 1 | 0 | 1 | 0 | 0 | 0 | 1 | 1 | 0 | 1 | 1 | 0 | 0 | 0 | 0 | 0 | 0 | 0 | 0 | 1 | 1 | 0 | 0 | 0 | 0 | 0 | 0 | 0 |
| MER0026061 | peptidase Clp | S14.001 | 1 | 1 | 0 | 0 | 1 | 0 | 0 | 0 | 0 | 0 | 0 | 0 | 0 | 1 | 0 | 0 | 1 | 0 | 0 | 0 | 0 | 1 | 0 | 1 | 0 | 1 | 0 | 0 | 0 | 0 | 0 | 0 | 0 | 1 | 1 | 0 | 0 | 0 | 0 | 0 | 0 | 1 |
| MER0026064 | Lon-A peptidase | S16.001 | 1 | 0 | 0 | 0 | 1 | 0 | 0 | 0 | 0 | 0 | 0 | 0 | 0 | 1 | 1 | 0 | 1 | 0 | 0 | 0 | 1 | 1 | 0 | 1 | 0 | 1 | 0 | 0 | 0 | 0 | 0 | 0 | 0 | 1 | 1 | 0 | 0 | 0 | 0 | 0 | 0 | 1 |
| MER0027987 | peptidase Clp | S14.001 | 1 | 1 | 0 | 0 | 1 | 0 | 0 | 0 | 0 | 0 | 0 | 0 | 0 | 1 | 0 | 0 | 1 | 0 | 0 | 0 | 0 | 1 | 0 | 1 | 0 | 1 | 0 | 0 | 0 | 0 | 0 | 0 | 0 | 1 | 1 | 0 | 0 | 0 | 0 | 0 | 0 | 1 |
To explore the MEROPS profiles we can use the following function:
-
get_subset_pca: which performs a PCA analysis to reduce the dimensions of the contributing families, resulting in a new table with the most represented MEROPS families of the bins/genome samples.
Some considerations:
-
To better visualize the results we recommend the loading of metadata, which essentially could include:
The clean names of the bins
Type of sampling
Environment
Hierarchical order
metadata <- read_excel("../inst/extdata/metadata_SIPH.xlsx")
head(metadata)| Clean_name | Bin_name | Name | Depth | Short_name | Phylum | Class | Genus | Database name |
|---|---|---|---|---|---|---|---|---|
| g_Flavobacterium_5m_16 | 5mSIPHEX2_16 | SIP_5_Bin16-g_Flavobacterium | Depth_5_meters | SIP_5_Bin16 | Bacteroidota | Flavobacteriia | Flavobacterium | 5mSIPHEX1_0.faa |
| g_Flavobacterium_5m_26 | 5mSIPHEX1_26 | SIP_5_Bin26-g_Flavobacterium | Depth_5_meters | SIP_5_Bin26 | Bacteroidota | Flavobacteriia | Flavobacterium | 5mSIPHEX1_1.faa |
| g_Henriciella_5m_15 | 5mSIPHEX1_15 | SIP_5_Bin15-g_Henriciella | Depth_5_meters | SIP_5_Bin15 | Pseudomonadota | Alphaproteobacteria | Henriciella | 5mSIPHEX1_10.faa |
| g_Hyphomonas_5m_32 | 5mSIPHEX1_32 | SIP_5_Bin32-g_Hyphomonas | Depth_5_meters | SIP_5_Bin32 | Pseudomonadota | Alphaproteobacteria | Hyphomonas | 5mSIPHEX1_11.faa |
| g_Hyphomonas_5m_33 | 5mSIPHEX1_33 | SIP_5_Bin33-g_Hyphomonas | Depth_5_meters | SIP_5_Bin33 | Pseudomonadota | Alphaproteobacteria | Hyphomonas | 5mSIPHEX1_13.faa |
| g_Celeribacter_5m_10 | 5mSIPHEX2_10 | SIP2_5_Bin10-g_Celeribacter | Depth_5_meters | SIP2_5_Bin10 | Pseudomonadota | Alphaproteobacteria | Celeribacter | 5mSIPHEX1_15.faa |
| g_Celeribacter_5m_0 | 5mSIPHEX1_0 | SIP_5_Bin0-g_Celeribacter | Depth_5_meters | SIP_5_Bin0 | Pseudomonadota | Alphaproteobacteria | Celeribacter | 5mSIPHEX1_18.faa |
| s_Planktomarina_temperata_5m_1 | 5mSIPHEX1_1 | SIP_5_Bin1-s_Planktomarina temperata | Depth_5_meters | SIP_5_Bin1 | Pseudomonadota | Alphaproteobacteria | Planktomarina | 5mSIPHEX1_19.faa |
| s_Lentibacter_algarum_5m_13 | 5mSIPHEX1_13 | SIP_5_Bin13-s_Lentibacter algarum | Depth_5_meters | SIP_5_Bin13 | Pseudomonadota | Alphaproteobacteria | Lentibacter | 5mSIPHEX1_2.faa |
| s_Lentibacter_algarum_5m_7 | 5mSIPHEX2_7 | SIP_5_Bin7-s_Lentibacter algarum | Depth_5_meters | SIP_5_Bin7 | Pseudomonadota | Alphaproteobacteria | Lentibacter | 5mSIPHEX1_25.faa |
Running get_subset_pca:
important_merops_FAMs<-get_subset_pca(tibble_rbims=MEROPS_Hidro_T_renamed,
                                     cos2_val=0.85,
                                     analysis="MEROPS")
head(important_merops_FAMs)To visualize the MEROPS subset we can use the following functions:
Use plot_heatmap with the argument
distance = T to visualize the clustering of the bins/genome
samples based on the MEROPS domains.
plot_heatmap(important_merops_FAMs,
             y_axis=MEROPS_family,
             analysis = "MEROPS",
             distance = T)
Figure 1. Clustering of MEROPS families across bins.
Use plot_heatmap with the argument
distance = F to visualize the presence/absence of MEROPS
domains across the bins/genome samples.
plot_heatmap(important_merops_FAMs,
             y_axis=MEROPS_family,
             analysis = "MEROPS",
             distance = F)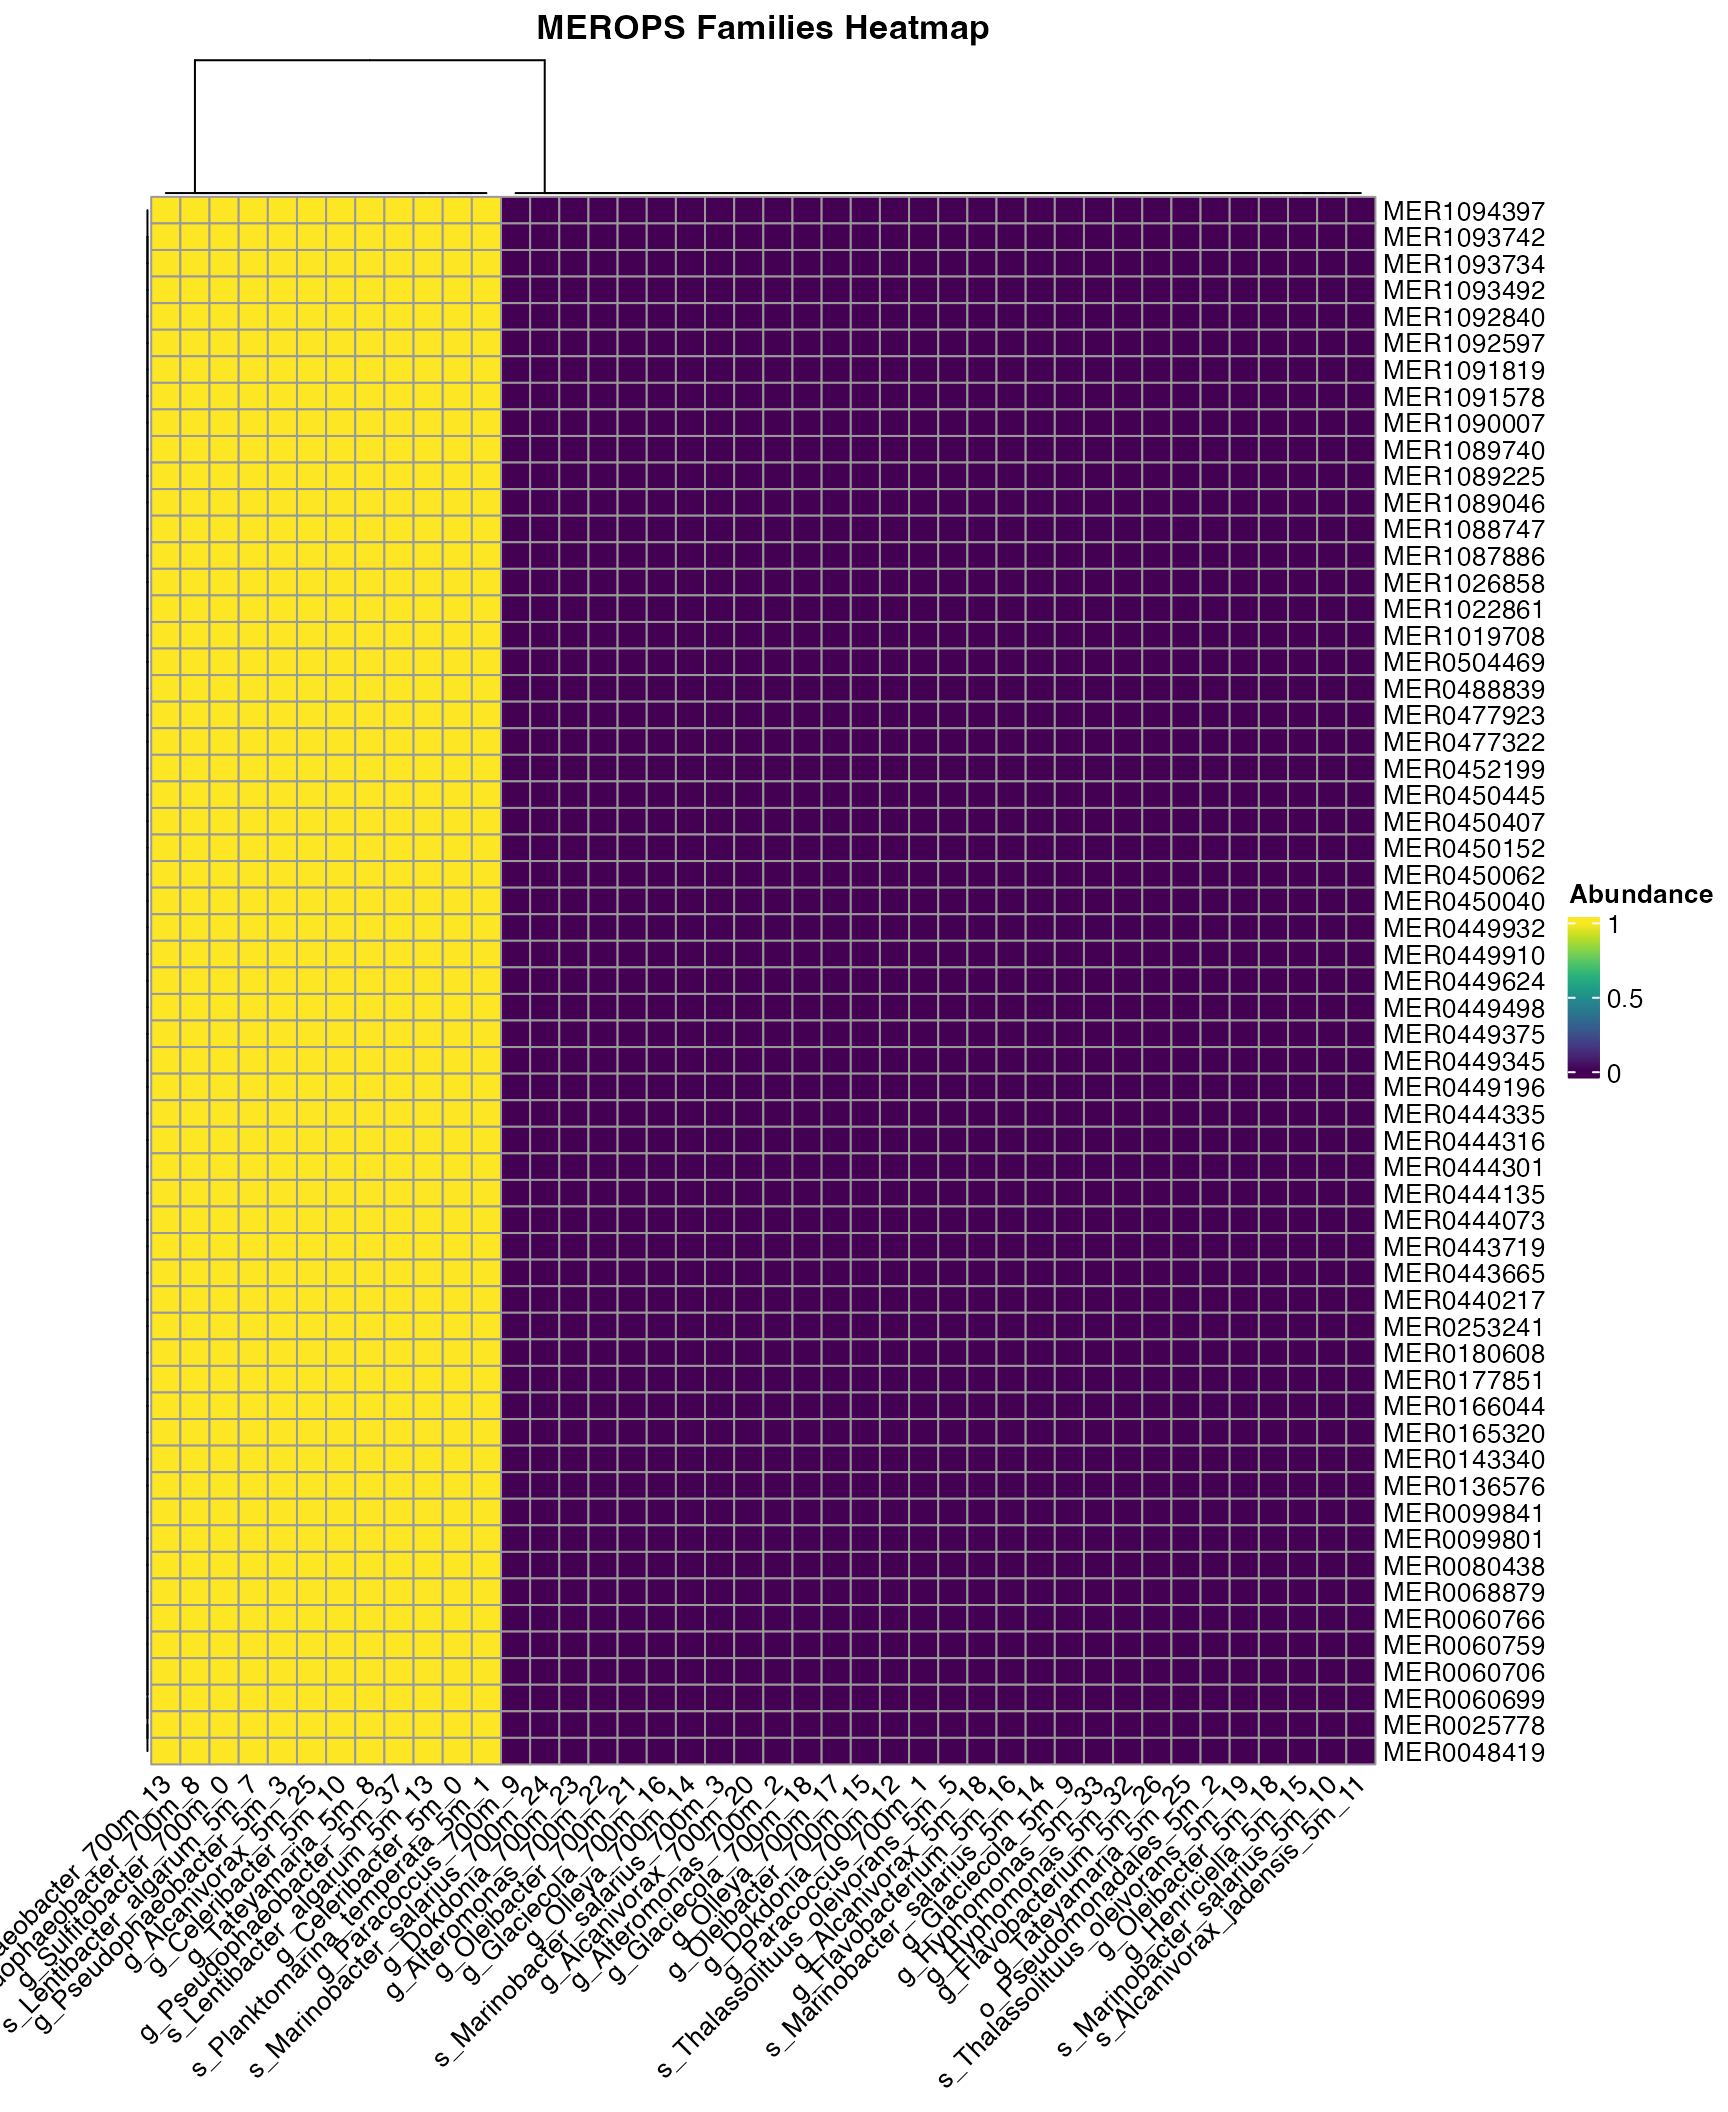
Figure 2. Presence/Absence of MEROPS families across bins.
For plot_bubble, the user has two options for the
argument calc:
- Binary
plot_bubble(important_merops_FAMs,
            y_axis=MEROPS_family,
            x_axis=Bin_name,
            calc = "Binary",
            analysis = "MEROPS",
            data_experiment = metadata_renamed,
            color_character = Depth,
            order_bins = ordered,
            y_labs = "Most contributing MEROPS families",
            text_y = 10,
            x_labs = "Bins",
            text_x = 9)
#> Scale for size is already present.
#> Adding another scale for size, which will replace the existing scale.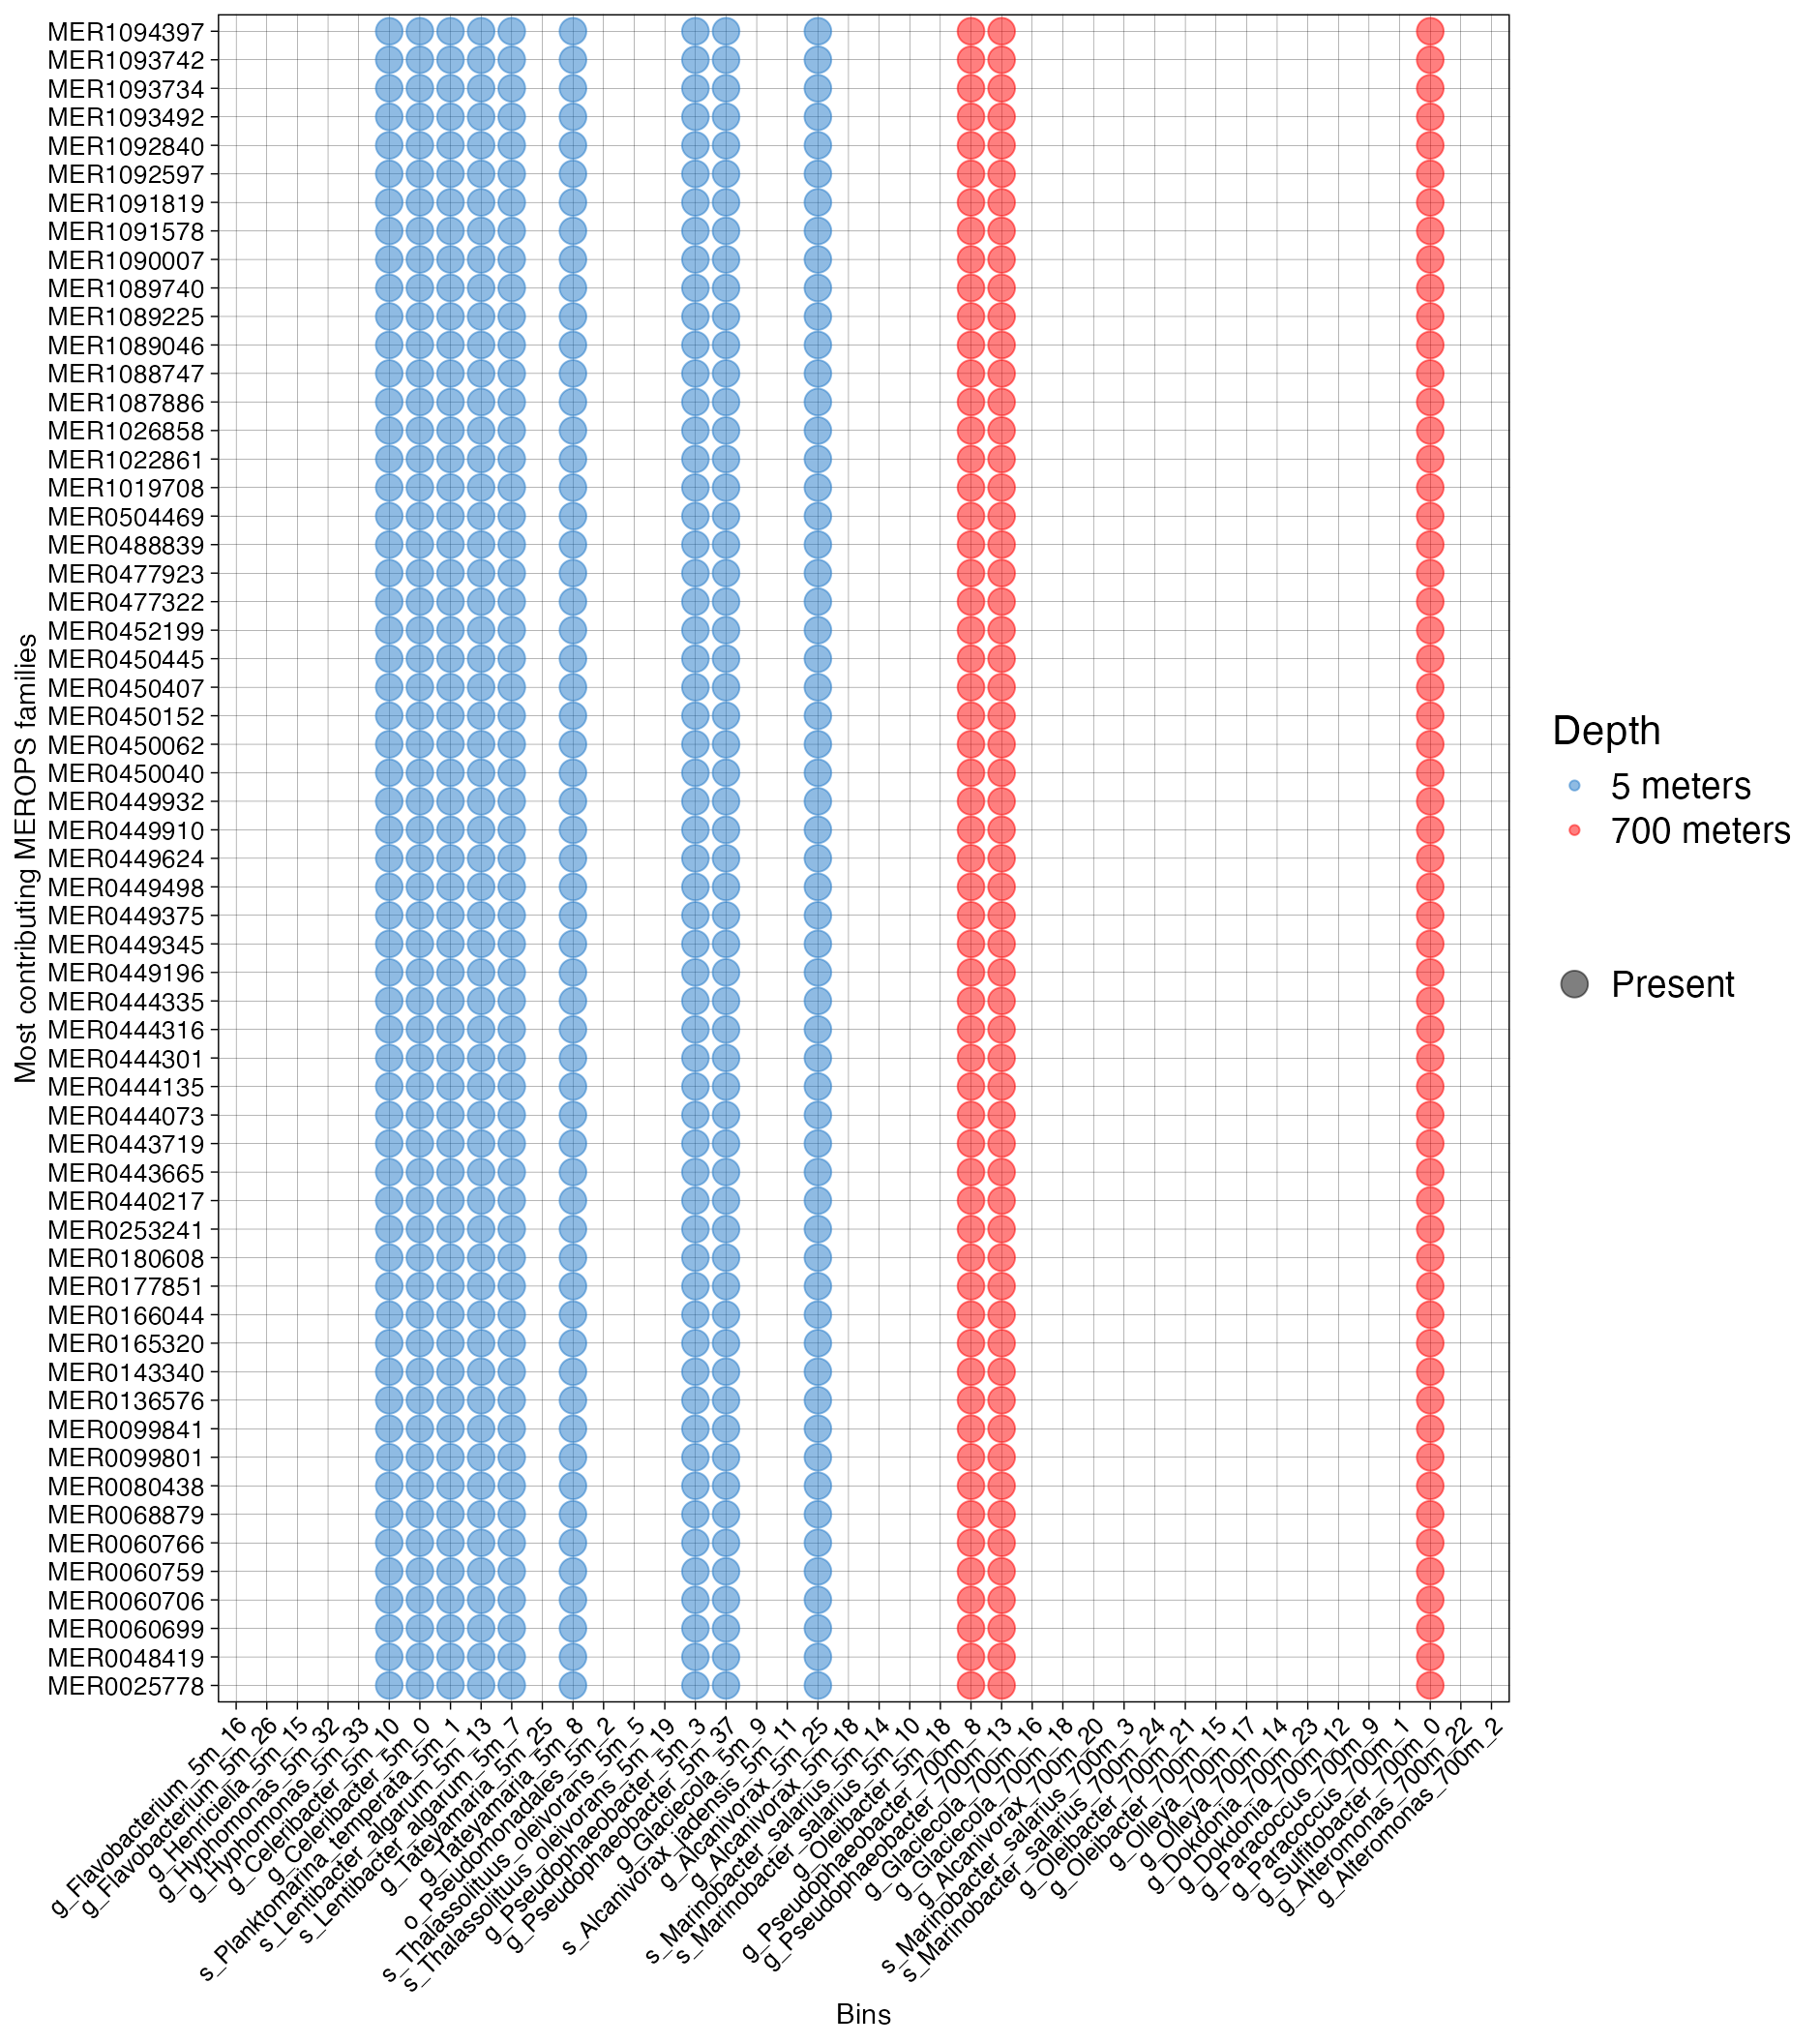
Figure 3. Presence of MEROPS families across bins.
Or
- Abundance
plot_bubble(important_merops_FAMs,
            y_axis=domain_name,
            x_axis=Bin_name,
            calc = "Abundance",
            analysis = "MEROPS",
            data_experiment = metadata_renamed,
            color_character = Class,
            y_labs = "Most contributing MEROPS families",
            text_y = 10,
            x_labs = "Bins",
            text_x = 9,
            range_size = c(1,5))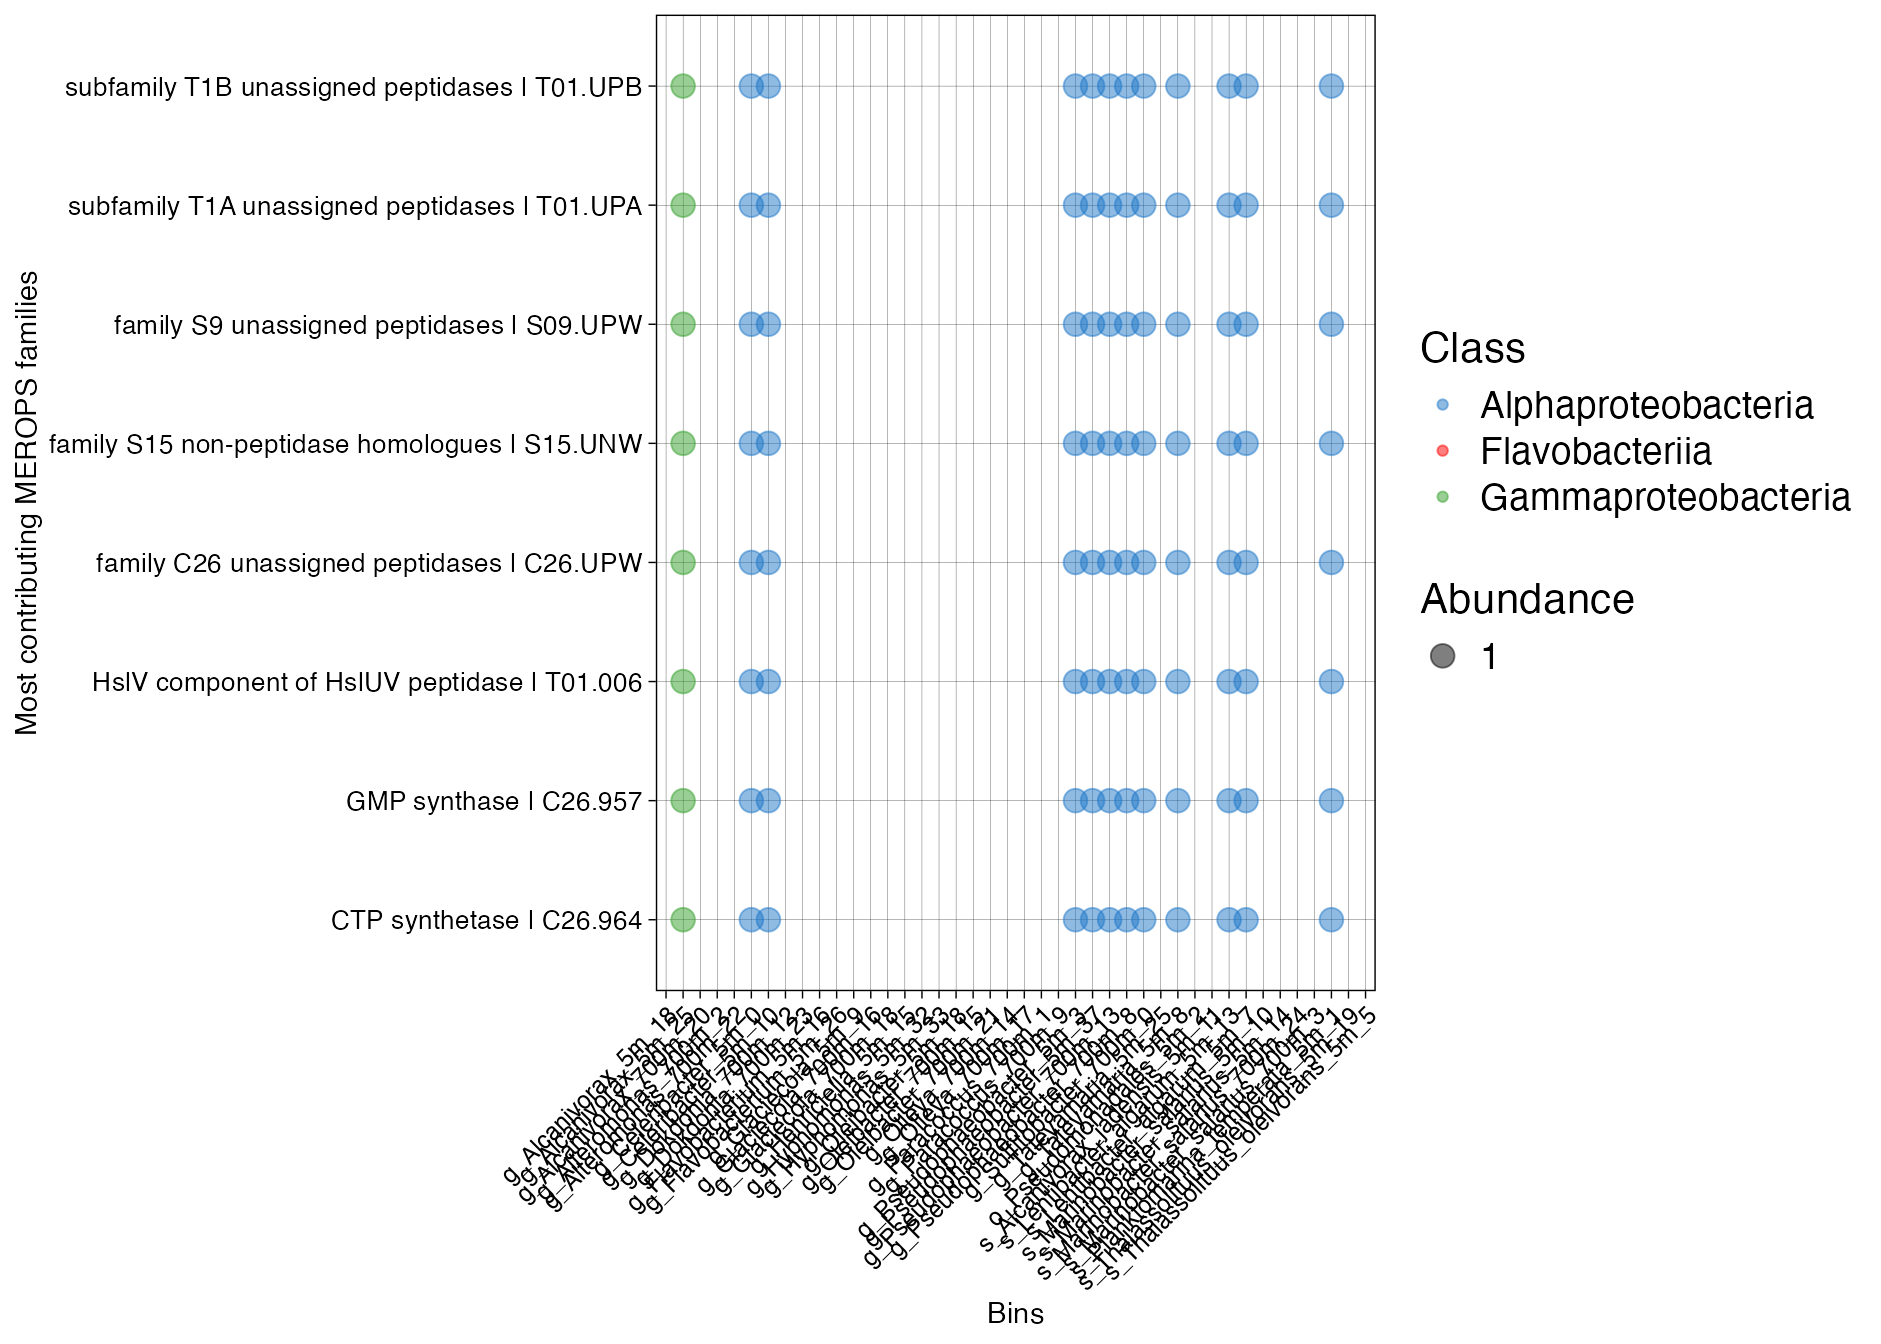
Figure 4. Abundance of MEROPS families across bins.