9. Explore InterProScan profile
Source:vignettes/09_Explore_InterProScan_profile.Rmd
09_Explore_InterProScan_profile.RmdFirst, make sure the library is loaded
If you want to follow this example, you can download the files from here file.
Now let’s load the long Interpro profile using the “Pfam” database:
pfam_profile <-read_interpro(data_interpro = "../inst/extdata/Interpro",
                             database = "Pfam",
                             profile = T,
                             write = F)
head(pfam_profile)| Pfam | domain_name | 5mSIPHEX1_0 | 5mSIPHEX1_1 | 5mSIPHEX1_10 | 5mSIPHEX1_11 | 5mSIPHEX1_13 | 5mSIPHEX1_15 | 5mSIPHEX1_18 | 5mSIPHEX1_19 | 5mSIPHEX1_2 | 5mSIPHEX1_25 | 5mSIPHEX1_26 | 5mSIPHEX1_32 | 5mSIPHEX1_33 | 5mSIPHEX1_37 | 5mSIPHEX1_8 | 5mSIPHEX1_9 | 5mSIPHEX2_10 | 5mSIPHEX2_14 | 5mSIPHEX2_16 | 5mSIPHEX2_18 | 5mSIPHEX2_25 | 5mSIPHEX2_3 | 5mSIPHEX2_5 | 5mSIPHEX2_7 | 700mSIPHEX1_0 | 700mSIPHEX1_1 | 700mSIPHEX1_12 | 700mSIPHEX1_15 | 700mSIPHEX1_17 | 700mSIPHEX1_18 | 700mSIPHEX1_2 | 700mSIPHEX1_20 | 700mSIPHEX1_3 | 700mSIPHEX1_8 | 700mSIPHEX2_13 | 700mSIPHEX2_14 | 700mSIPHEX2_16 | 700mSIPHEX2_21 | 700mSIPHEX2_22 | 700mSIPHEX2_23 | 700mSIPHEX2_24 | 700mSIPHEX2_9 |
|---|---|---|---|---|---|---|---|---|---|---|---|---|---|---|---|---|---|---|---|---|---|---|---|---|---|---|---|---|---|---|---|---|---|---|---|---|---|---|---|---|---|---|---|
| PF00005 | ABC transporter | 74 | 42 | 76 | 30 | 54 | 21 | 28 | 26 | 27 | 30 | 20 | 28 | 21 | 61 | 100 | 20 | 69 | 78 | 16 | 31 | 91 | 60 | 29 | 54 | 41 | 98 | 36 | 29 | 29 | 36 | 32 | 33 | 76 | 44 | 44 | 29 | 36 | 29 | 33 | 34 | 34 | 83 |
| PF08352 | Oligopeptide/dipeptide transporter, C-terminal region | 13 | 4 | 3 | 1 | 7 | 1 | 1 | 0 | 0 | 1 | 0 | 1 | 1 | 6 | 10 | 0 | 12 | 3 | 0 | 1 | 8 | 6 | 0 | 7 | 6 | 11 | 1 | 1 | 1 | 1 | 1 | 1 | 3 | 3 | 3 | 1 | 1 | 1 | 1 | 1 | 2 | 10 |
| PF06242 | Transcriptional cell cycle regulator TrcR | 1 | 1 | 0 | 0 | 1 | 1 | 0 | 0 | 0 | 0 | 0 | 0 | 0 | 1 | 1 | 0 | 1 | 0 | 0 | 0 | 1 | 1 | 0 | 1 | 0 | 1 | 0 | 0 | 0 | 0 | 0 | 0 | 0 | 0 | 0 | 0 | 0 | 0 | 0 | 0 | 0 | 1 |
| PF00586 | AIR synthase related protein, N-terminal domain | 3 | 1 | 2 | 3 | 2 | 4 | 3 | 1 | 3 | 3 | 2 | 4 | 2 | 2 | 2 | 2 | 3 | 2 | 1 | 3 | 2 | 2 | 2 | 2 | 1 | 3 | 3 | 3 | 2 | 3 | 2 | 3 | 2 | 0 | 0 | 2 | 3 | 3 | 2 | 3 | 2 | 3 |
| PF02769 | AIR synthase related protein, C-terminal domain | 3 | 1 | 3 | 3 | 2 | 4 | 4 | 1 | 3 | 3 | 2 | 4 | 2 | 2 | 2 | 3 | 3 | 3 | 2 | 3 | 2 | 2 | 2 | 2 | 2 | 3 | 4 | 4 | 3 | 4 | 3 | 3 | 3 | 0 | 0 | 3 | 4 | 4 | 3 | 4 | 3 | 3 |
| PF02021 | Uncharacterised protein family UPF0102 | 1 | 1 | 1 | 1 | 1 | 1 | 1 | 1 | 1 | 1 | 0 | 1 | 1 | 1 | 1 | 1 | 1 | 2 | 1 | 1 | 1 | 1 | 1 | 1 | 0 | 1 | 1 | 1 | 1 | 1 | 1 | 1 | 1 | 1 | 1 | 1 | 1 | 1 | 1 | 1 | 1 | 1 |
| PF01654 | Cytochrome bd terminal oxidase subunit I | 1 | 0 | 1 | 1 | 0 | 0 | 0 | 1 | 0 | 1 | 0 | 1 | 1 | 0 | 0 | 2 | 1 | 1 | 0 | 1 | 0 | 0 | 1 | 0 | 1 | 2 | 0 | 1 | 1 | 2 | 3 | 1 | 1 | 0 | 0 | 1 | 2 | 1 | 3 | 0 | 1 | 2 |
| PF00528 | Binding-protein-dependent transport system inner membrane component | 54 | 30 | 39 | 10 | 31 | 3 | 7 | 8 | 4 | 10 | 0 | 9 | 2 | 40 | 78 | 2 | 53 | 39 | 0 | 10 | 67 | 36 | 9 | 31 | 31 | 59 | 2 | 6 | 2 | 8 | 6 | 12 | 39 | 29 | 29 | 2 | 8 | 6 | 7 | 2 | 18 | 52 |
| PF00920 | Dehydratase family | 4 | 2 | 3 | 2 | 2 | 2 | 2 | 2 | 2 | 2 | 0 | 2 | 0 | 2 | 5 | 2 | 4 | 3 | 0 | 3 | 4 | 2 | 1 | 2 | 2 | 3 | 1 | 2 | 1 | 2 | 2 | 2 | 3 | 1 | 1 | 1 | 2 | 2 | 2 | 1 | 2 | 3 |
| PF01458 | SUF system FeS cluster assembly, SufBD | 2 | 2 | 2 | 2 | 2 | 2 | 4 | 0 | 2 | 2 | 2 | 2 | 2 | 0 | 2 | 0 | 2 | 2 | 2 | 2 | 2 | 0 | 2 | 2 | 1 | 2 | 2 | 2 | 2 | 0 | 2 | 2 | 2 | 0 | 0 | 2 | 0 | 2 | 2 | 2 | 0 | 2 |
To explore the Interpro profiles we can use the following function:
-
get_subset_pca: which performs a PCA analysis to reduce the dimensions of the contributing families, resulting in a new table with the most represented Pfam families (for this example) of the bins/genome samples.
Some considerations:
To better visualize the results we recommend the loading of metadata, which essentially could include:
The clean names of the bins
Type of sampling
Environment
Hierarchical order
metadata <- read_excel("../inst/extdata/metadata_SIPH.xlsx")
head(metadata)| Clean_name | Bin_name | Name | Depth | Short_name | Phylum | Class | Genus | Database name |
|---|---|---|---|---|---|---|---|---|
| g_Flavobacterium_5m_16 | 5mSIPHEX2_16 | SIP_5_Bin16-g_Flavobacterium | Depth_5_meters | SIP_5_Bin16 | Bacteroidota | Flavobacteriia | Flavobacterium | 5mSIPHEX1_0.faa |
| g_Flavobacterium_5m_26 | 5mSIPHEX1_26 | SIP_5_Bin26-g_Flavobacterium | Depth_5_meters | SIP_5_Bin26 | Bacteroidota | Flavobacteriia | Flavobacterium | 5mSIPHEX1_1.faa |
| g_Henriciella_5m_15 | 5mSIPHEX1_15 | SIP_5_Bin15-g_Henriciella | Depth_5_meters | SIP_5_Bin15 | Pseudomonadota | Alphaproteobacteria | Henriciella | 5mSIPHEX1_10.faa |
| g_Hyphomonas_5m_32 | 5mSIPHEX1_32 | SIP_5_Bin32-g_Hyphomonas | Depth_5_meters | SIP_5_Bin32 | Pseudomonadota | Alphaproteobacteria | Hyphomonas | 5mSIPHEX1_11.faa |
| g_Hyphomonas_5m_33 | 5mSIPHEX1_33 | SIP_5_Bin33-g_Hyphomonas | Depth_5_meters | SIP_5_Bin33 | Pseudomonadota | Alphaproteobacteria | Hyphomonas | 5mSIPHEX1_13.faa |
| g_Celeribacter_5m_10 | 5mSIPHEX2_10 | SIP2_5_Bin10-g_Celeribacter | Depth_5_meters | SIP2_5_Bin10 | Pseudomonadota | Alphaproteobacteria | Celeribacter | 5mSIPHEX1_15.faa |
| g_Celeribacter_5m_0 | 5mSIPHEX1_0 | SIP_5_Bin0-g_Celeribacter | Depth_5_meters | SIP_5_Bin0 | Pseudomonadota | Alphaproteobacteria | Celeribacter | 5mSIPHEX1_18.faa |
| s_Planktomarina_temperata_5m_1 | 5mSIPHEX1_1 | SIP_5_Bin1-s_Planktomarina temperata | Depth_5_meters | SIP_5_Bin1 | Pseudomonadota | Alphaproteobacteria | Planktomarina | 5mSIPHEX1_19.faa |
| s_Lentibacter_algarum_5m_13 | 5mSIPHEX1_13 | SIP_5_Bin13-s_Lentibacter algarum | Depth_5_meters | SIP_5_Bin13 | Pseudomonadota | Alphaproteobacteria | Lentibacter | 5mSIPHEX1_2.faa |
| s_Lentibacter_algarum_5m_7 | 5mSIPHEX2_7 | SIP_5_Bin7-s_Lentibacter algarum | Depth_5_meters | SIP_5_Bin7 | Pseudomonadota | Alphaproteobacteria | Lentibacter | 5mSIPHEX1_25.faa |
#Extra commands to clean the bin names

lookup <- setNames(metadata$Bin_name, metadata$Clean_name)

pfam_profile_renamed <- pfam_profile %>%
  rename(!!!lookup)
important_PFAMs<-get_subset_pca(tibble_rbims=pfam_profile_renamed,
                                cos2_val=0.96,
                                analysis="Pfam")
head(important_PFAMs)To visualize the InterproScan subset we can use the following functions:
Use plot_heatmap with the argument
distance = T to visualize the clustering of the bins/genome
samples based on the InterproScan domains.
plot_heatmap(important_PFAMs,
             y_axis=Pfam,
             analysis = "INTERPRO",
             distance = T)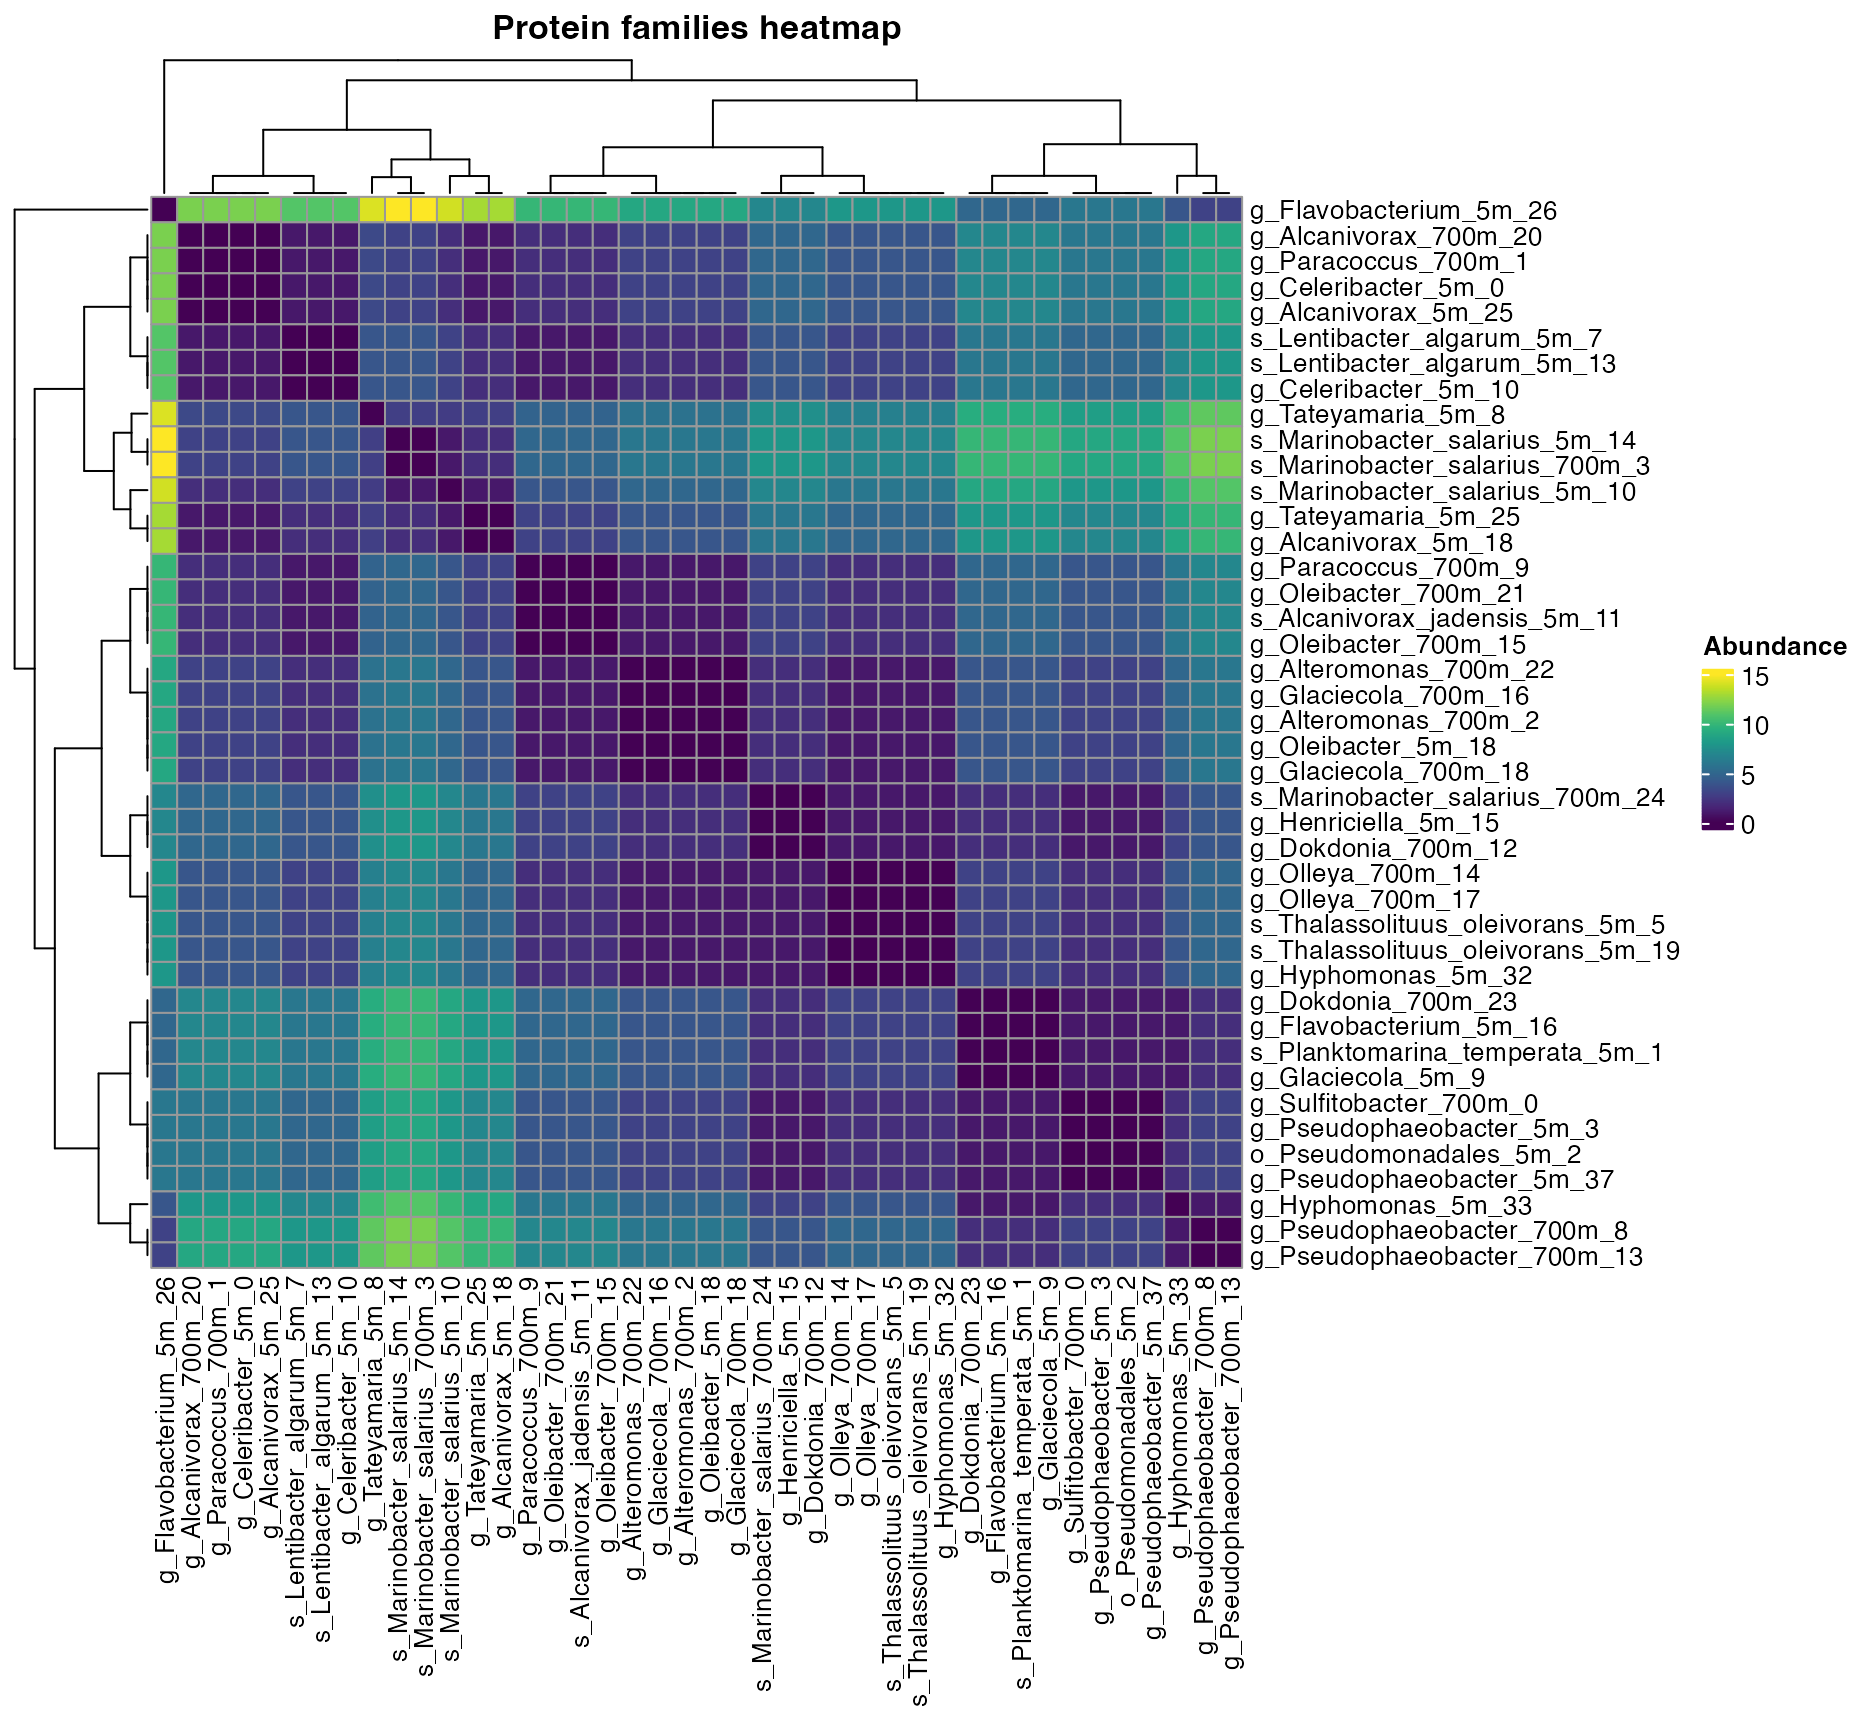
Figure 1. Clustering of InterproScan families across bins.
Use plot_heatmap with the argument
distance = F to visualize the abundance of InterproScan
domains across the bins/genome samples.
plot_heatmap(important_PFAMs,
             y_axis=Pfam,
             analysis = "INTERPRO",
             distance = F)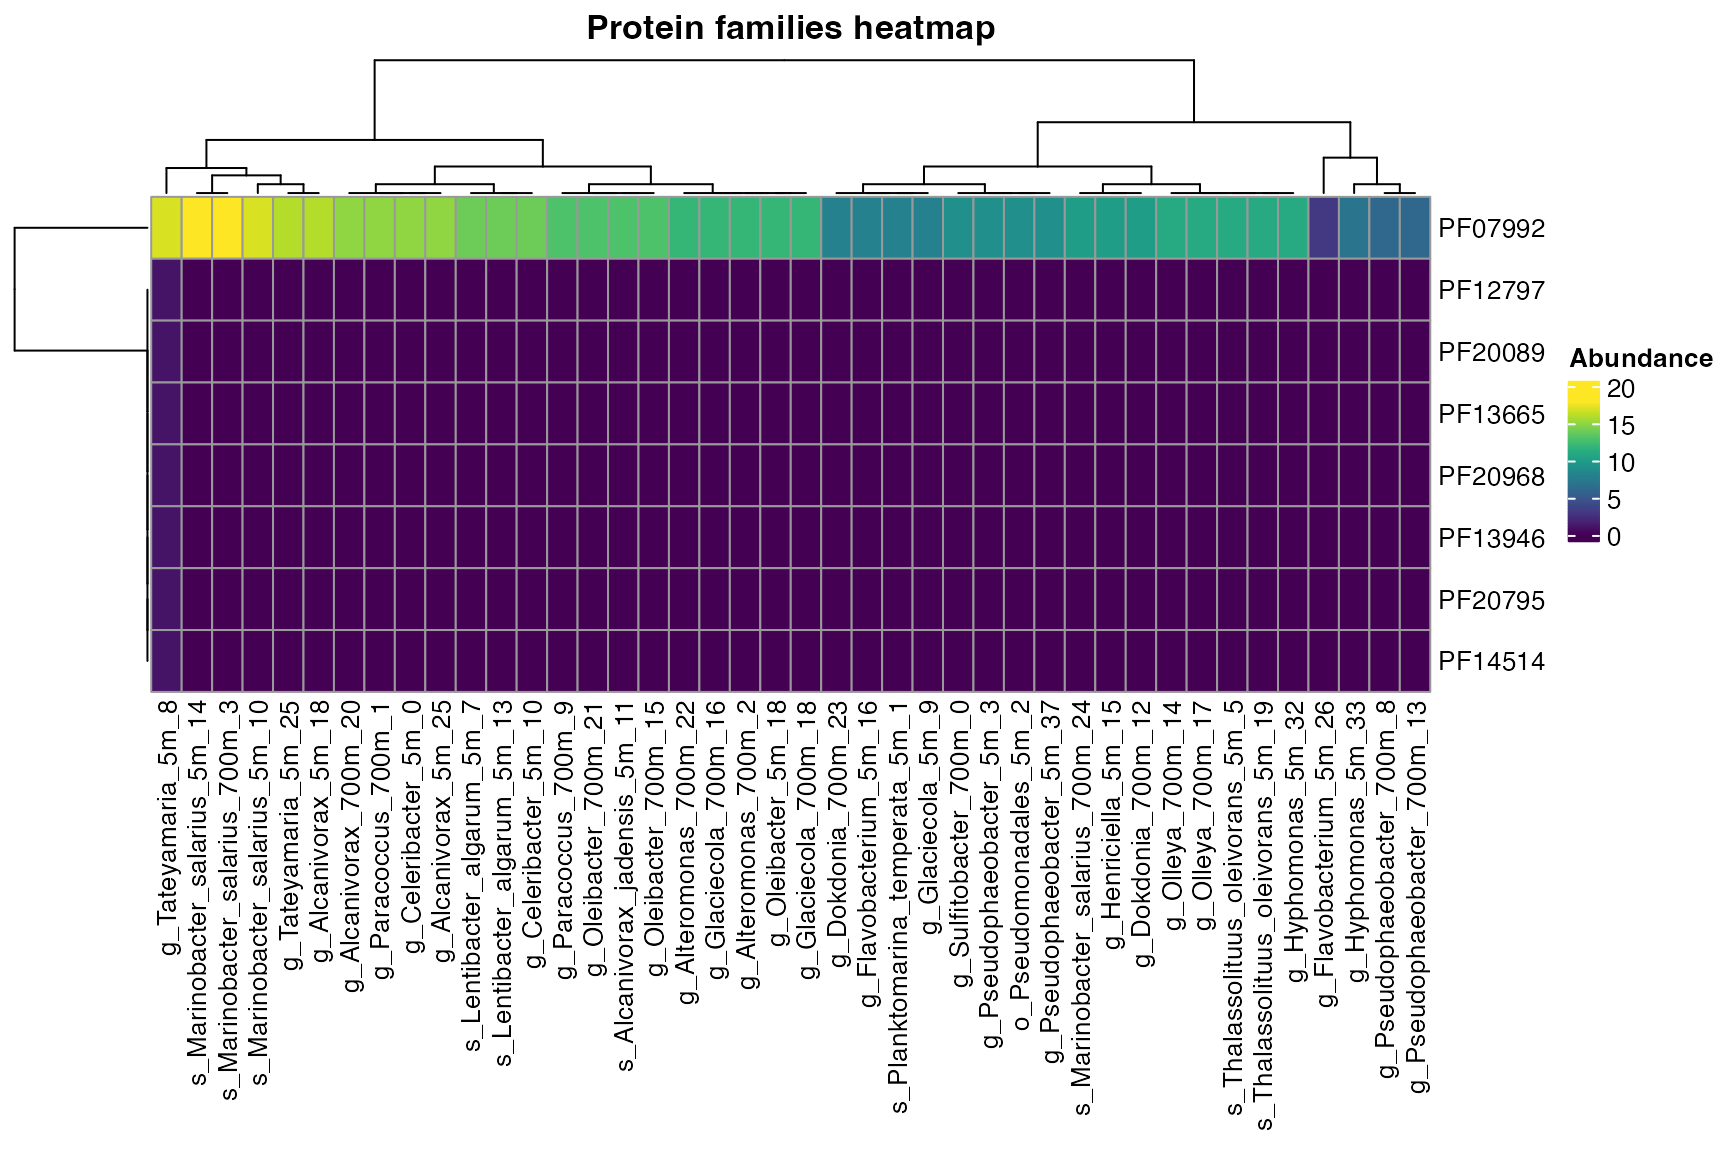
Figure 2. Presence/Absence of InterproScan families across bins.
For plot_bubble, the user has two options for the
argument calc:
- Binary
plot_bubble(important_PFAMs,
            y_axis=Pfam,
            x_axis=Bin_name,
            calc = "Binary",
            analysis = "INTERPRO",
            data_experiment = metadata_renamed,
            color_character = Depth,
            order_bins = ordered,
            y_labs = "Most contributing InterproScan families",
            text_y = 10,
            x_labs = "Bins",
            text_x = 9)
#> Scale for size is already present.
#> Adding another scale for size, which will replace the existing scale.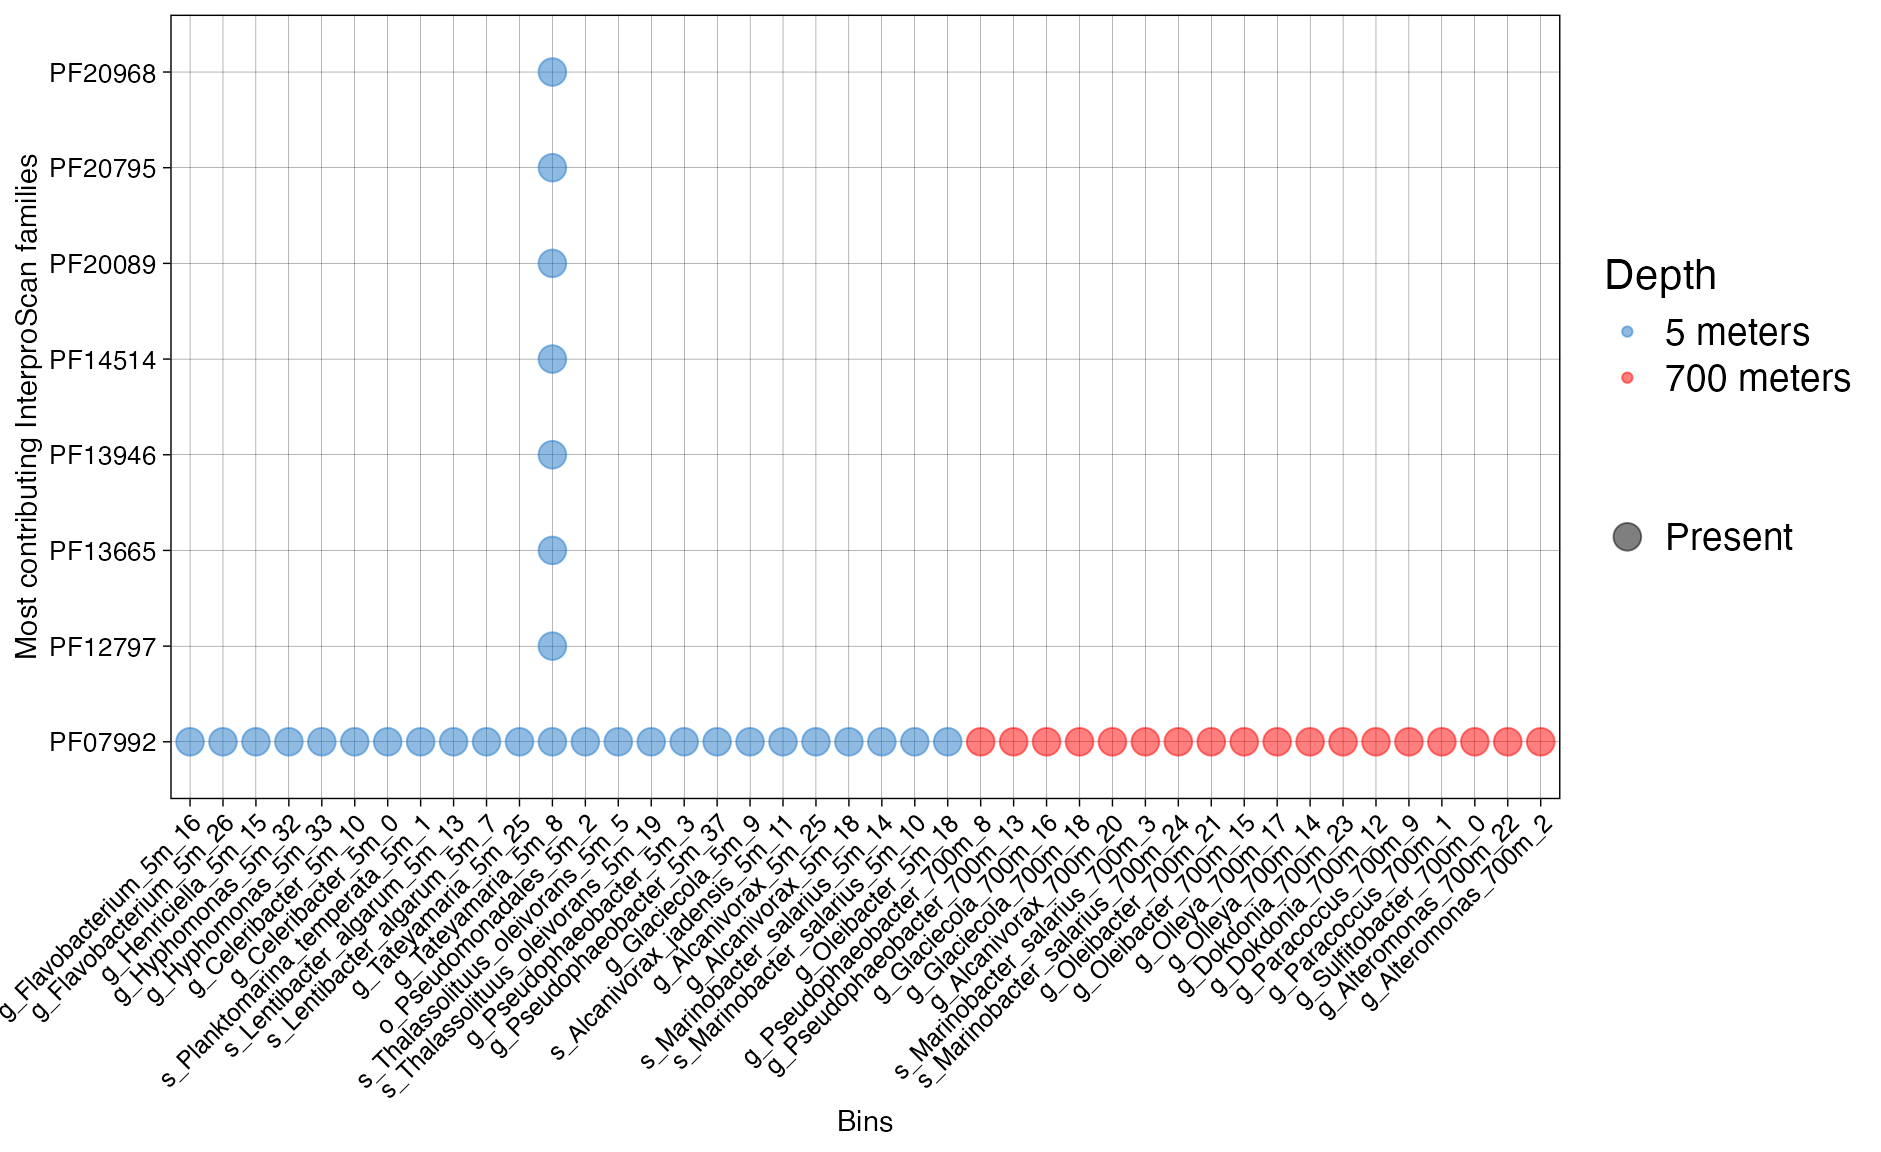
Figure 3. Presence of InterproScan families across bins.
Or
- Abundance
plot_bubble(important_PFAMs,
            y_axis=Pfam,
            x_axis=Bin_name,
            calc = "Abundance",
            analysis = "INTERPRO",
            data_experiment = metadata_renamed,
            color_character = Class,
            y_labs = "Most contributing InterproScan families",
            text_y = 10,
            x_labs = "Bins",
            text_x = 9,
            range_size = c(1,15))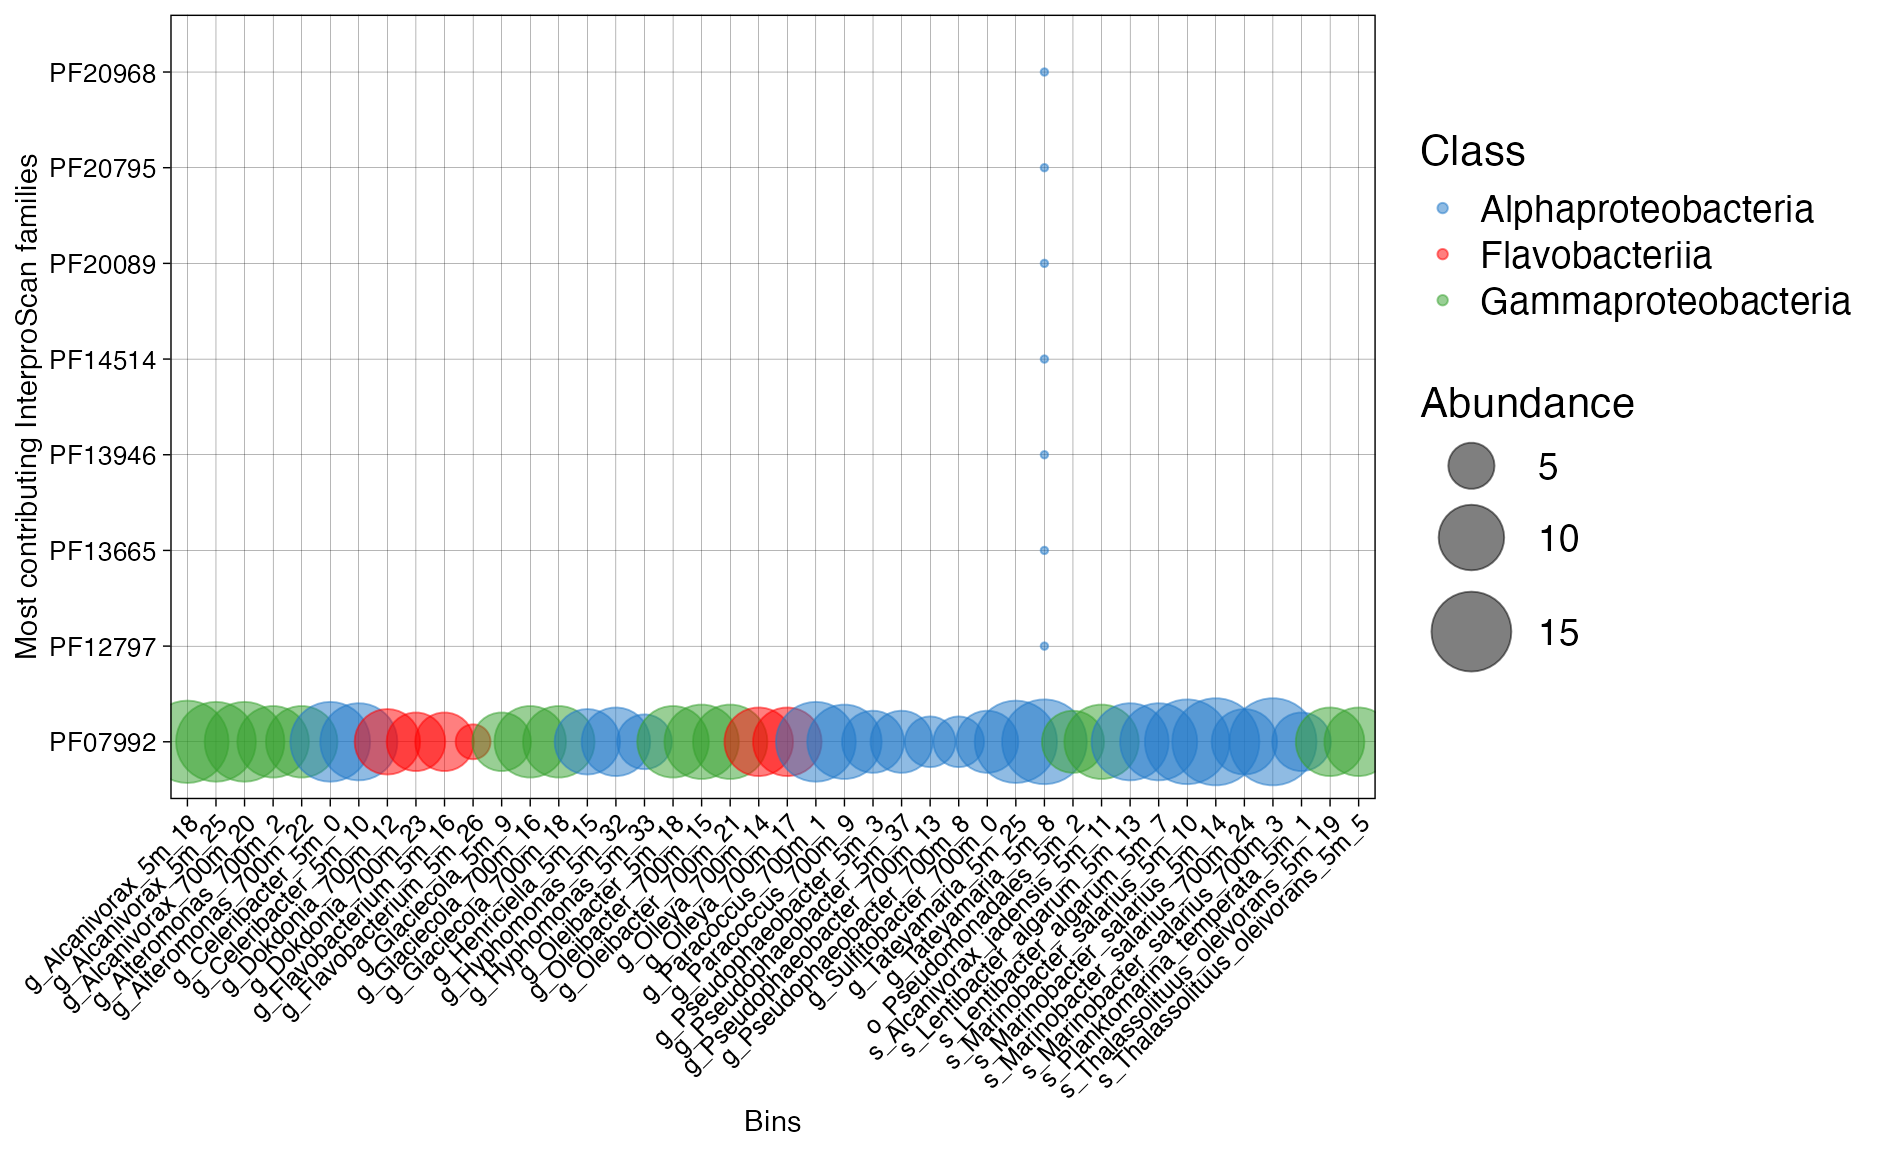
Figure 4. Abundance of InterproScan families across bins.
Exploring other databases within InterproScan
Because the annotation with InterproScan recovers data from different databases, rbims can also explore not only Pfams, but also TigerFams, Superamilies or InterproScan ID’s. First, we will reload the InterProScan output in a wide format and extract the PFAM abundance information.
Let’s load the long Interpro profile using the “INTERPRO” database:
interpro_profile <-read_interpro(data_interpro ="../inst/extdata/Interpro",
                                 profile = T,
                                 database = "INTERPRO",
                                 write = F)
head(interpro_profile)| INTERPRO | domain_name | 5mSIPHEX1_0 | 5mSIPHEX1_1 | 5mSIPHEX1_10 | 5mSIPHEX1_11 | 5mSIPHEX1_13 | 5mSIPHEX1_15 | 5mSIPHEX1_18 | 5mSIPHEX1_19 | 5mSIPHEX1_2 | 5mSIPHEX1_25 | 5mSIPHEX1_26 | 5mSIPHEX1_32 | 5mSIPHEX1_33 | 5mSIPHEX1_37 | 5mSIPHEX1_8 | 5mSIPHEX1_9 | 5mSIPHEX2_10 | 5mSIPHEX2_14 | 5mSIPHEX2_16 | 5mSIPHEX2_18 | 5mSIPHEX2_25 | 5mSIPHEX2_3 | 5mSIPHEX2_5 | 5mSIPHEX2_7 | 700mSIPHEX1_0 | 700mSIPHEX1_1 | 700mSIPHEX1_12 | 700mSIPHEX1_15 | 700mSIPHEX1_17 | 700mSIPHEX1_18 | 700mSIPHEX1_2 | 700mSIPHEX1_20 | 700mSIPHEX1_3 | 700mSIPHEX1_8 | 700mSIPHEX2_13 | 700mSIPHEX2_14 | 700mSIPHEX2_16 | 700mSIPHEX2_21 | 700mSIPHEX2_22 | 700mSIPHEX2_23 | 700mSIPHEX2_24 | 700mSIPHEX2_9 |
|---|---|---|---|---|---|---|---|---|---|---|---|---|---|---|---|---|---|---|---|---|---|---|---|---|---|---|---|---|---|---|---|---|---|---|---|---|---|---|---|---|---|---|---|
|
|
|
2391 | 1580 | 3106 | 2391 | 2133 | 2316 | 2021 | 2238 | 1892 | 2424 | 1320 | 2665 | 1785 | 1905 | 3346 | 1963 | 2286 | 3437 | 1494 | 2533 | 3002 | 1844 | 2221 | 2137 | 1513 | 2583 | 2394 | 2444 | 2287 | 2858 | 2657 | 2595 | 3062 | 1281 | 1277 | 2287 | 2851 | 2442 | 2664 | 2292 | 1843 | 2422 |
| IPR003593 | AAA+ ATPase domain | 100 | 64 | 126 | 61 | 84 | 51 | 59 | 62 | 53 | 67 | 29 | 57 | 43 | 79 | 137 | 50 | 95 | 132 | 33 | 67 | 124 | 78 | 65 | 83 | 52 | 129 | 59 | 66 | 54 | 80 | 70 | 72 | 126 | 59 | 58 | 54 | 80 | 66 | 70 | 57 | 71 | 114 |
| IPR003439 | ABC transporter-like, ATP-binding domain | 75 | 43 | 77 | 31 | 55 | 22 | 29 | 27 | 28 | 31 | 20 | 28 | 21 | 64 | 104 | 21 | 70 | 79 | 17 | 32 | 94 | 63 | 30 | 55 | 41 | 98 | 36 | 30 | 31 | 37 | 34 | 34 | 77 | 46 | 46 | 31 | 37 | 30 | 35 | 34 | 35 | 83 |
| IPR017871 | ABC transporter-like, conserved site | 63 | 34 | 63 | 24 | 49 | 15 | 20 | 19 | 24 | 24 | 10 | 21 | 15 | 49 | 85 | 18 | 59 | 65 | 10 | 25 | 76 | 50 | 21 | 49 | 34 | 83 | 26 | 22 | 23 | 31 | 30 | 27 | 63 | 35 | 35 | 23 | 31 | 22 | 31 | 25 | 30 | 71 |
| IPR027417 | P-loop containing nucleoside triphosphate hydrolase | 198 | 132 | 243 | 156 | 166 | 142 | 148 | 171 | 144 | 168 | 99 | 155 | 109 | 167 | 267 | 137 | 181 | 277 | 104 | 185 | 231 | 162 | 163 | 168 | 111 | 228 | 153 | 176 | 149 | 196 | 182 | 171 | 240 | 110 | 110 | 149 | 196 | 176 | 172 | 141 | 151 | 209 |
| IPR013563 | Oligopeptide/dipeptide ABC transporter, C-terminal | 13 | 4 | 3 | 1 | 7 | 1 | 1 | 0 | 0 | 1 | 0 | 1 | 1 | 6 | 10 | 0 | 12 | 3 | 0 | 1 | 8 | 6 | 0 | 7 | 6 | 11 | 1 | 1 | 1 | 1 | 1 | 1 | 3 | 3 | 3 | 1 | 1 | 1 | 1 | 1 | 2 | 10 |
| IPR010421 | Transcriptional cell cycle regulator TrcR | 1 | 1 | 0 | 0 | 1 | 1 | 0 | 0 | 0 | 0 | 0 | 0 | 0 | 1 | 1 | 0 | 1 | 0 | 0 | 0 | 1 | 1 | 0 | 1 | 0 | 1 | 0 | 0 | 0 | 0 | 0 | 0 | 0 | 0 | 0 | 0 | 0 | 0 | 0 | 0 | 0 | 1 |
| IPR016188 | PurM-like, N-terminal domain | 3 | 1 | 2 | 3 | 2 | 4 | 3 | 1 | 3 | 3 | 2 | 4 | 2 | 2 | 2 | 2 | 3 | 2 | 1 | 3 | 2 | 2 | 2 | 2 | 1 | 3 | 3 | 3 | 2 | 3 | 2 | 3 | 2 | 0 | 0 | 2 | 3 | 3 | 2 | 3 | 2 | 3 |
| IPR036921 | PurM-like, N-terminal domain superfamily | 3 | 1 | 3 | 4 | 2 | 4 | 4 | 2 | 4 | 4 | 3 | 4 | 2 | 2 | 2 | 3 | 3 | 3 | 2 | 4 | 2 | 2 | 3 | 2 | 1 | 3 | 4 | 4 | 3 | 4 | 3 | 4 | 3 | 0 | 0 | 3 | 4 | 4 | 3 | 4 | 3 | 3 |
| IPR010918 | PurM-like, C-terminal domain | 3 | 1 | 3 | 3 | 2 | 4 | 4 | 1 | 3 | 3 | 2 | 4 | 2 | 2 | 2 | 3 | 3 | 3 | 2 | 3 | 2 | 2 | 2 | 2 | 2 | 3 | 4 | 4 | 3 | 4 | 3 | 3 | 3 | 0 | 0 | 3 | 4 | 4 | 3 | 4 | 3 | 3 |
We are going to look for the InterProScan IDs that conform the
DNA topoisomerase 1. To do this, we will create a vector of
the IDs associated to that enzyme.
DNA_topoisomerase_1<-c("IPR013497", "IPR023406", "IPR013824")With the function get_subset_pathway we can create a subset of the INTERPRO table.
DNA_topo_INTERPRO<-get_subset_pathway(interpro_profile,
                                      type_of_interest_feature=INTERPRO,
                                      interest_feature=DNA_topoisomerase_1)
head(DNA_topo_INTERPRO)| INTERPRO | domain_name | 5mSIPHEX1_0 | 5mSIPHEX1_1 | 5mSIPHEX1_10 | 5mSIPHEX1_11 | 5mSIPHEX1_13 | 5mSIPHEX1_15 | 5mSIPHEX1_18 | 5mSIPHEX1_19 | 5mSIPHEX1_2 | 5mSIPHEX1_25 | 5mSIPHEX1_26 | 5mSIPHEX1_32 | 5mSIPHEX1_33 | 5mSIPHEX1_37 | 5mSIPHEX1_8 | 5mSIPHEX1_9 | 5mSIPHEX2_10 | 5mSIPHEX2_14 | 5mSIPHEX2_16 | 5mSIPHEX2_18 | 5mSIPHEX2_25 | 5mSIPHEX2_3 | 5mSIPHEX2_5 | 5mSIPHEX2_7 | 700mSIPHEX1_0 | 700mSIPHEX1_1 | 700mSIPHEX1_12 | 700mSIPHEX1_15 | 700mSIPHEX1_17 | 700mSIPHEX1_18 | 700mSIPHEX1_2 | 700mSIPHEX1_20 | 700mSIPHEX1_3 | 700mSIPHEX1_8 | 700mSIPHEX2_13 | 700mSIPHEX2_14 | 700mSIPHEX2_16 | 700mSIPHEX2_21 | 700mSIPHEX2_22 | 700mSIPHEX2_23 | 700mSIPHEX2_24 | 700mSIPHEX2_9 |
|---|---|---|---|---|---|---|---|---|---|---|---|---|---|---|---|---|---|---|---|---|---|---|---|---|---|---|---|---|---|---|---|---|---|---|---|---|---|---|---|---|---|---|---|
| IPR023406 | DNA topoisomerase, type IA, active site | 1 | 1 | 2 | 0 | 1 | 1 | 2 | 2 | 2 | 2 | 1 | 1 | 0 | 1 | 1 | 0 | 1 | 3 | 1 | 1 | 1 | 1 | 2 | 1 | 0 | 1 | 1 | 2 | 1 | 1 | 2 | 1 | 2 | 1 | 1 | 1 | 1 | 2 | 2 | 1 | 2 | 1 |
| IPR013497 | DNA topoisomerase, type IA, central | 1 | 2 | 2 | 0 | 1 | 1 | 2 | 2 | 2 | 2 | 1 | 1 | 0 | 1 | 1 | 0 | 1 | 4 | 1 | 1 | 1 | 1 | 2 | 1 | 0 | 1 | 1 | 2 | 2 | 1 | 2 | 1 | 2 | 1 | 1 | 2 | 1 | 2 | 2 | 1 | 2 | 1 |
| IPR013824 | DNA topoisomerase, type IA, central region, subdomain 1 | 1 | 2 | 2 | 0 | 1 | 1 | 2 | 2 | 2 | 2 | 1 | 1 | 0 | 1 | 1 | 0 | 1 | 4 | 1 | 1 | 1 | 1 | 2 | 1 | 0 | 1 | 1 | 2 | 2 | 1 | 2 | 1 | 2 | 1 | 1 | 2 | 1 | 2 | 2 | 1 | 2 | 1 |
To visualize it, we can create a bubble plot to explore the distribution of these enzymes across the bins.
plot_bubble(DNA_topo_INTERPRO,
            y_axis=INTERPRO,
            x_axis=Bin_name,
            calc = "Abundance",
            analysis = "INTERPRO",
            data_experiment = metadata,
            color_character = Depth)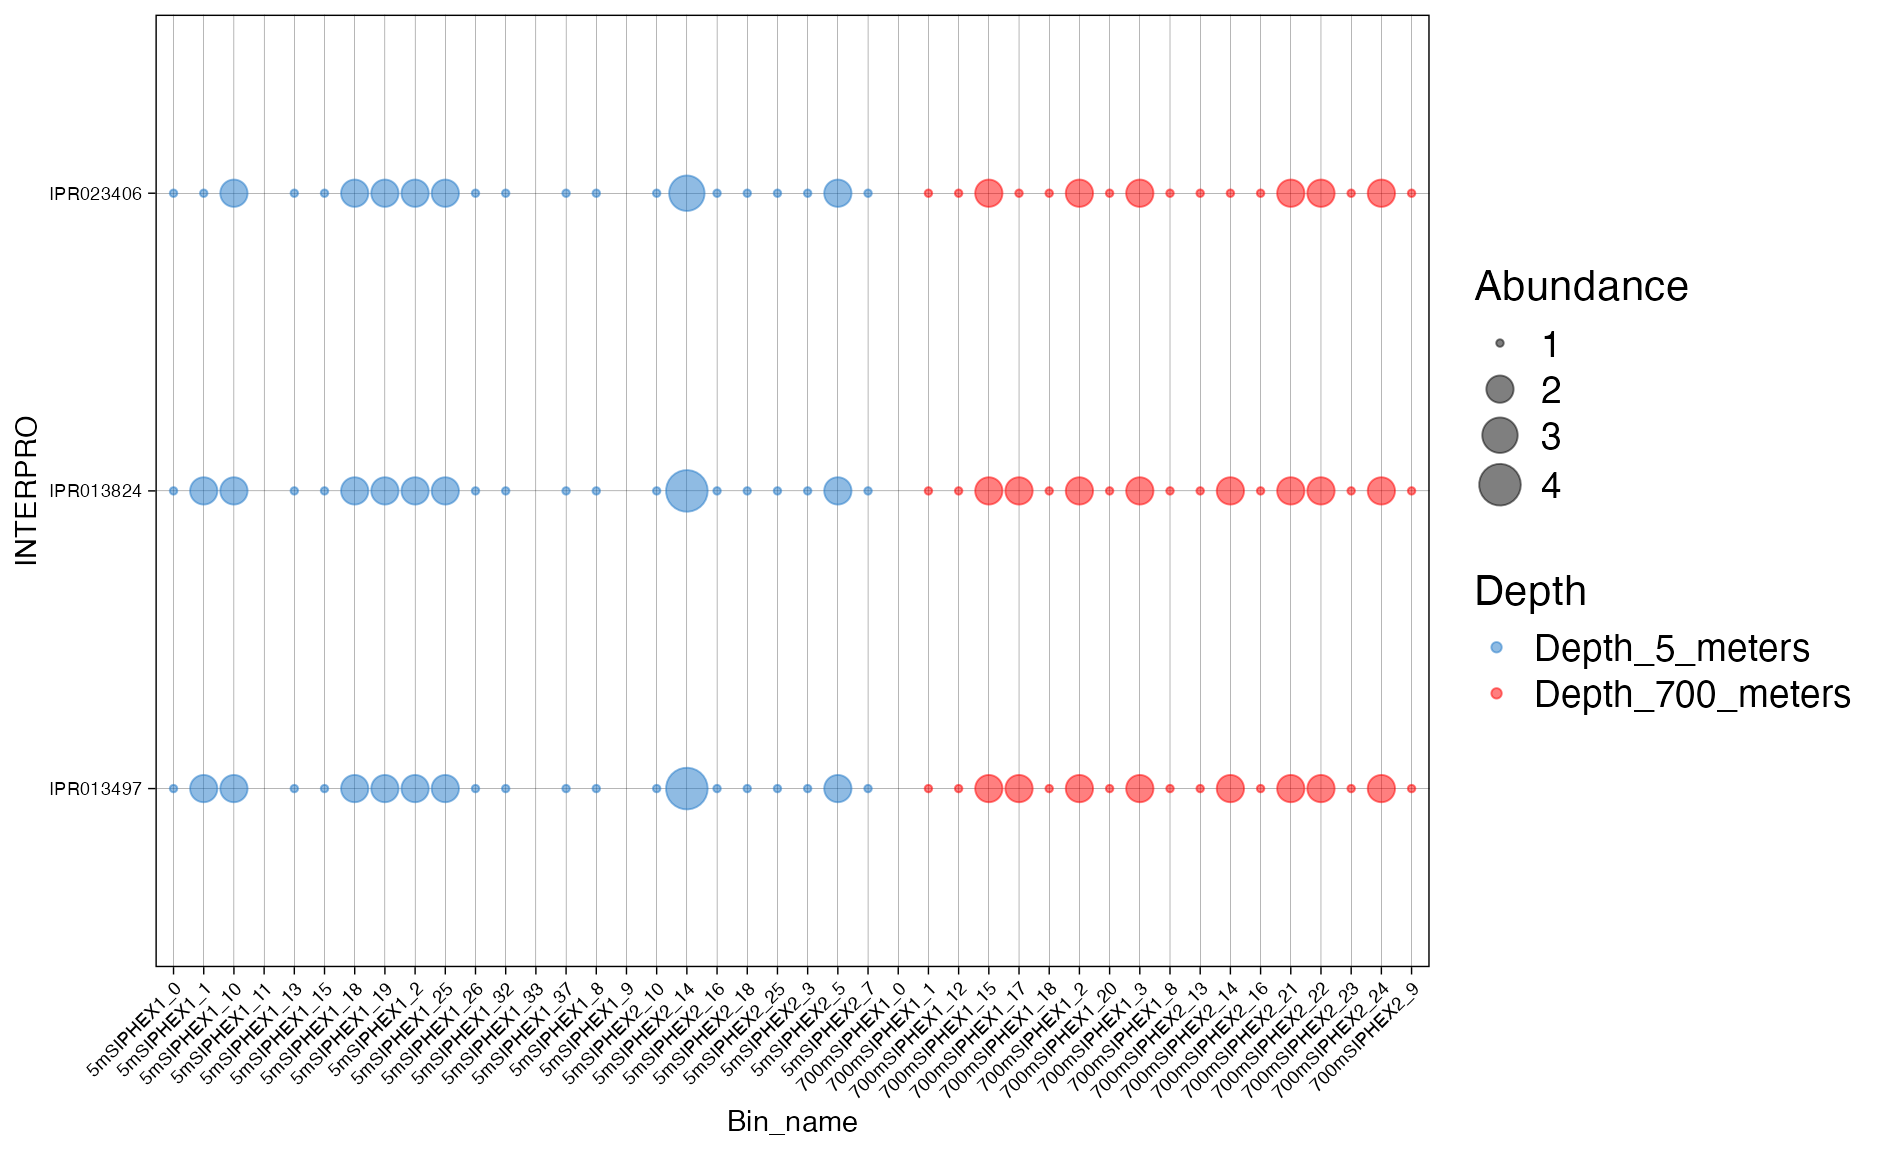
Figure 5. Abundance of InterproScan families conforming the DNA topoisomerase pathway across bins.