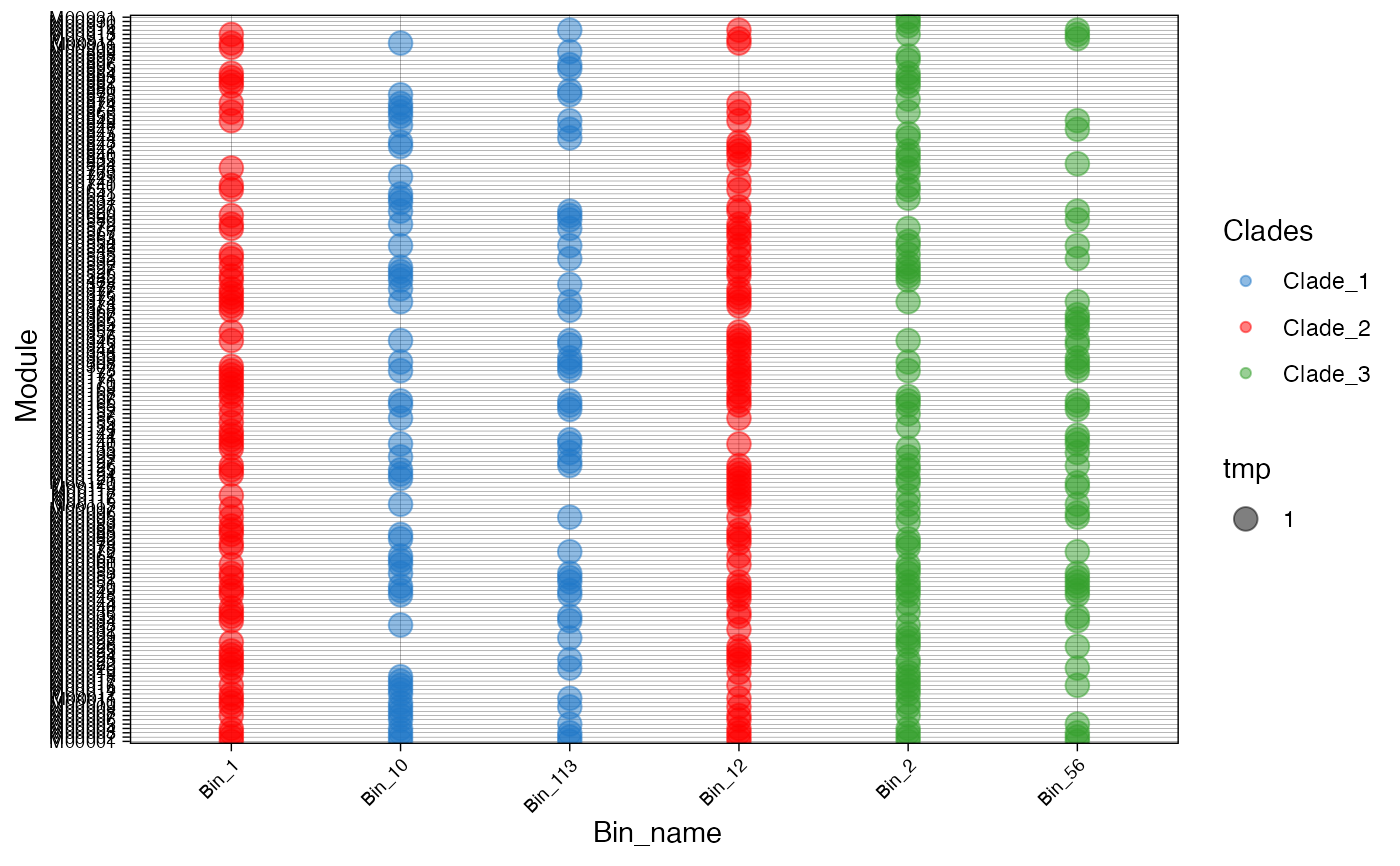
Creates a bubble plot of the data of bins metabolism
plot_bubble(tibble_ko, x_axis, y_axis, analysis=c("KEGG","INTERPRO", "dbCAN", "MEROPS"),
data_experiment=NULL, calc=NULL, color_character=NULL, order_bins=NULL,
order_metabolism=NULL, color_pallet=NULL, range_size=NULL, x_labs=TRUE,
y_labs=TRUE, text_x=NULL, text_y=NULL)
Arguments
- tibble_ko
a tibble object, created with the read_* mapping_ko and get_subset_* functions.
- x_axis
a string, a column name of the metabolism table. It determined the x axis label.
- y_axis
a string, a column name of the metabolism table. It determined the y axis label.
- analysis
a character indicating if your input data are from KEGG, INTERPRO, dbCAN or MEROPS.
- data_experiment
optional. a data frame object containing metadata information.
- calc
a character indicating with type of calc should be done to plot the results. Valid values are "Abundance", "Binary", "Percentage", and "None". If you choose none you are expected to use a tibble table obtained from calc_binary or calc_percentage.
- color_character
optional. a string column name of the metadata or metabolism object, used for color.
- order_bins
optional. a character vector indicating the bin order.
- order_metabolism
optional. a character vector indicating metabolism order.
- color_pallet
optional. a character vector of colors to use.
- range_size
optional. a numeric vector indicating the range size of the dots.
- x_labs
optional. If FALSE it will set the x lab to NULL.
- y_labs
optional. If FALSE it will set the y lab to NULL.
- text_x
optional. A numeric vector indicating the size of the x text letters.
- text_y
optional. A numeric vector indicating the size of the y text letters.
Details
This function is part of a package used for the analysis of bins metabolism.
Examples
plot_bubble(tibble_ko=ko_bin_mapp, x_axis=Bin_name, y_axis=Module,
analysis="KEGG", data_experiment=metadata, calc="Binary",
color_character=Clades)
#> Warning: if your vector is >25, choose another color pallet. Make sure you
#>             are renaming your variables correctly.
#> Warning: Removed 603 rows containing missing values or values outside the scale range
#> (`geom_point()`).
