10. Explore dbcan profile
Source:vignettes/10_Explore_dbcan_profile.Rmd
10_Explore_dbcan_profile.RmdMake sure the library is loaded
Let’s load the dbcan3 profile:
dbcan_profile_T <-read_dbcan3(dbcan_path = "../inst/extdata/dbCAN",
                              profile = T,
                              write = F)
head(dbcan_profile_T)| dbCAN_family | domain_name | 5mSIPHEX1_0 | 5mSIPHEX1_1 | 5mSIPHEX1_10 | 5mSIPHEX1_11 | 5mSIPHEX1_13 | 5mSIPHEX1_15 | 5mSIPHEX1_18 | 5mSIPHEX1_19 | 5mSIPHEX1_2 | 5mSIPHEX1_25 | 5mSIPHEX1_26 | 5mSIPHEX1_32 | 5mSIPHEX1_33 | 5mSIPHEX1_37 | 5mSIPHEX1_8 | 5mSIPHEX1_9 | 5mSIPHEX2_10 | 5mSIPHEX2_14 | 5mSIPHEX2_16 | 5mSIPHEX2_18 | 5mSIPHEX2_25 | 5mSIPHEX2_3 | 5mSIPHEX2_5 | 5mSIPHEX2_7 | 700mSIPHEX1_0 | 700mSIPHEX1_1 | 700mSIPHEX1_12 | 700mSIPHEX1_15 | 700mSIPHEX1_17 | 700mSIPHEX1_18 | 700mSIPHEX1_2 | 700mSIPHEX1_20 | 700mSIPHEX1_3 | 700mSIPHEX1_8 | 700mSIPHEX2_13 | 700mSIPHEX2_14 | 700mSIPHEX2_16 | 700mSIPHEX2_21 | 700mSIPHEX2_22 | 700mSIPHEX2_23 | 700mSIPHEX2_24 | 700mSIPHEX2_9 |
|---|---|---|---|---|---|---|---|---|---|---|---|---|---|---|---|---|---|---|---|---|---|---|---|---|---|---|---|---|---|---|---|---|---|---|---|---|---|---|---|---|---|---|---|
| AA1 | auxiliary activities [AAs] | 4 | 0 | 9 | 1 | 1 | 4 | 0 | 0 | 0 | 16 | 0 | 4 | 0 | 0 | 4 | 1 | 4 | 9 | 0 | 25 | 16 | 0 | 0 | 1 | 1 | 0 | 1 | 1 | 4 | 1 | 0 | 1 | 9 | 0 | 0 | 4 | 1 | 1 | 1 | 0 | 4 | 0 |
| AA4 | auxiliary activities [AAs] | 4 | 0 | 0 | 1 | 1 | 0 | 1 | 0 | 1 | 0 | 1 | 0 | 0 | 1 | 1 | 0 | 4 | 0 | 1 | 0 | 4 | 1 | 0 | 1 | 1 | 0 | 0 | 1 | 0 | 0 | 1 | 1 | 0 | 1 | 1 | 0 | 0 | 1 | 1 | 0 | 0 | 0 |
| CBM48 | carbohydrate-binding module [CBM] | 9 | 0 | 0 | 0 | 0 | 0 | 0 | 0 | 0 | 0 | 0 | 0 | 0 | 0 | 4 | 1 | 9 | 0 | 0 | 0 | 4 | 0 | 0 | 0 | 0 | 16 | 1 | 0 | 1 | 1 | 1 | 0 | 0 | 0 | 0 | 1 | 1 | 0 | 1 | 1 | 0 | 9 |
| CBM50 | carbohydrate-binding module [CBM] | 4 | 4 | 1 | 9 | 1 | 0 | 0 | 4 | 4 | 9 | 9 | 0 | 0 | 4 | 4 | 9 | 4 | 1 | 9 | 9 | 4 | 4 | 4 | 1 | 4 | 4 | 1 | 1 | 1 | 9 | 9 | 9 | 1 | 1 | 1 | 1 | 9 | 1 | 9 | 1 | 0 | 4 |
| CE11 | carbohydrate esterases [CEs] | 1 | 1 | 1 | 1 | 1 | 1 | 1 | 1 | 1 | 1 | 1 | 1 | 1 | 1 | 1 | 1 | 1 | 1 | 1 | 1 | 1 | 1 | 1 | 1 | 0 | 1 | 1 | 1 | 1 | 1 | 1 | 1 | 1 | 1 | 1 | 1 | 1 | 1 | 1 | 1 | 1 | 1 |
| CE14 | carbohydrate esterases [CEs] | 9 | 0 | 0 | 0 | 0 | 0 | 0 | 0 | 0 | 0 | 1 | 1 | 0 | 0 | 0 | 0 | 4 | 0 | 1 | 0 | 0 | 0 | 0 | 0 | 0 | 1 | 1 | 1 | 1 | 0 | 0 | 0 | 0 | 0 | 0 | 1 | 0 | 1 | 0 | 1 | 0 | 1 |
| CE4 | carbohydrate esterases [CEs] | 1 | 1 | 25 | 0 | 1 | 1 | 1 | 4 | 4 | 0 | 1 | 0 | 0 | 4 | 1 | 1 | 1 | 25 | 1 | 0 | 1 | 4 | 1 | 1 | 0 | 4 | 1 | 1 | 4 | 4 | 9 | 0 | 25 | 4 | 4 | 4 | 4 | 1 | 9 | 1 | 9 | 4 |
| GH1 | glycoside hydrolases [GHs] | 1 | 1 | 0 | 0 | 0 | 0 | 0 | 0 | 0 | 0 | 0 | 0 | 0 | 0 | 1 | 0 | 1 | 0 | 0 | 0 | 1 | 0 | 0 | 0 | 0 | 1 | 0 | 0 | 0 | 0 | 1 | 0 | 0 | 0 | 0 | 0 | 0 | 0 | 1 | 0 | 0 | 1 |
| GH102 | glycoside hydrolases [GHs] | 1 | 1 | 0 | 0 | 1 | 1 | 0 | 0 | 0 | 0 | 0 | 1 | 1 | 1 | 1 | 0 | 1 | 0 | 0 | 0 | 1 | 1 | 0 | 1 | 1 | 0 | 0 | 0 | 0 | 0 | 0 | 0 | 0 | 1 | 1 | 0 | 0 | 0 | 0 | 0 | 0 | 0 |
| GH103 | glycoside hydrolases [GHs] | 9 | 1 | 4 | 4 | 16 | 1 | 1 | 1 | 1 | 4 | 0 | 1 | 1 | 16 | 16 | 4 | 9 | 4 | 0 | 4 | 16 | 16 | 1 | 16 | 16 | 1 | 0 | 1 | 0 | 4 | 4 | 4 | 4 | 4 | 4 | 0 | 4 | 1 | 4 | 0 | 1 | 1 |
To explore the dbCAN profiles we can use the following function:
-
get_subset_pca: which performs a PCA analysis to reduce the dimensions of the contributing families, resulting in a new table with the most represented dbCAN families of the bins/genome samples.
Some considerations:
-
To better visualize the results we recommend the loading of metadata, which essentially could include:
The clean names of the bins
Type of sampling
Environment
Hierarchical order
metadata <- read_excel("../inst/extdata/metadata_SIPH.xlsx")
head(metadata)| Clean_name | Bin_name | Name | Depth | Short_name | Phylum | Class | Genus | Database name |
|---|---|---|---|---|---|---|---|---|
| g_Flavobacterium_5m_16 | 5mSIPHEX2_16 | SIP_5_Bin16-g_Flavobacterium | Depth_5_meters | SIP_5_Bin16 | Bacteroidota | Flavobacteriia | Flavobacterium | 5mSIPHEX1_0.faa |
| g_Flavobacterium_5m_26 | 5mSIPHEX1_26 | SIP_5_Bin26-g_Flavobacterium | Depth_5_meters | SIP_5_Bin26 | Bacteroidota | Flavobacteriia | Flavobacterium | 5mSIPHEX1_1.faa |
| g_Henriciella_5m_15 | 5mSIPHEX1_15 | SIP_5_Bin15-g_Henriciella | Depth_5_meters | SIP_5_Bin15 | Pseudomonadota | Alphaproteobacteria | Henriciella | 5mSIPHEX1_10.faa |
| g_Hyphomonas_5m_32 | 5mSIPHEX1_32 | SIP_5_Bin32-g_Hyphomonas | Depth_5_meters | SIP_5_Bin32 | Pseudomonadota | Alphaproteobacteria | Hyphomonas | 5mSIPHEX1_11.faa |
| g_Hyphomonas_5m_33 | 5mSIPHEX1_33 | SIP_5_Bin33-g_Hyphomonas | Depth_5_meters | SIP_5_Bin33 | Pseudomonadota | Alphaproteobacteria | Hyphomonas | 5mSIPHEX1_13.faa |
| g_Celeribacter_5m_10 | 5mSIPHEX2_10 | SIP2_5_Bin10-g_Celeribacter | Depth_5_meters | SIP2_5_Bin10 | Pseudomonadota | Alphaproteobacteria | Celeribacter | 5mSIPHEX1_15.faa |
| g_Celeribacter_5m_0 | 5mSIPHEX1_0 | SIP_5_Bin0-g_Celeribacter | Depth_5_meters | SIP_5_Bin0 | Pseudomonadota | Alphaproteobacteria | Celeribacter | 5mSIPHEX1_18.faa |
| s_Planktomarina_temperata_5m_1 | 5mSIPHEX1_1 | SIP_5_Bin1-s_Planktomarina temperata | Depth_5_meters | SIP_5_Bin1 | Pseudomonadota | Alphaproteobacteria | Planktomarina | 5mSIPHEX1_19.faa |
| s_Lentibacter_algarum_5m_13 | 5mSIPHEX1_13 | SIP_5_Bin13-s_Lentibacter algarum | Depth_5_meters | SIP_5_Bin13 | Pseudomonadota | Alphaproteobacteria | Lentibacter | 5mSIPHEX1_2.faa |
| s_Lentibacter_algarum_5m_7 | 5mSIPHEX2_7 | SIP_5_Bin7-s_Lentibacter algarum | Depth_5_meters | SIP_5_Bin7 | Pseudomonadota | Alphaproteobacteria | Lentibacter | 5mSIPHEX1_25.faa |
Running get_subset_pca:
important_dbCAN_FAMs<-get_subset_pca(tibble_rbims=dbCAN_Hidro_T_renamed,
                                     cos2_val=0.8,
                                     analysis="dbCAN")
head(important_dbCAN_FAMs)To visualize the dbCAN subset we can use the following functions:
Use plot_heatmap with the argument
distance = T to visualize the clustering of the bins/genome
samples based on the dbCAN domains.
plot_heatmap(important_dbCAN_FAMs,
             y_axis=dbCAN_family,
             analysis = "dbCAN",
             distance = T)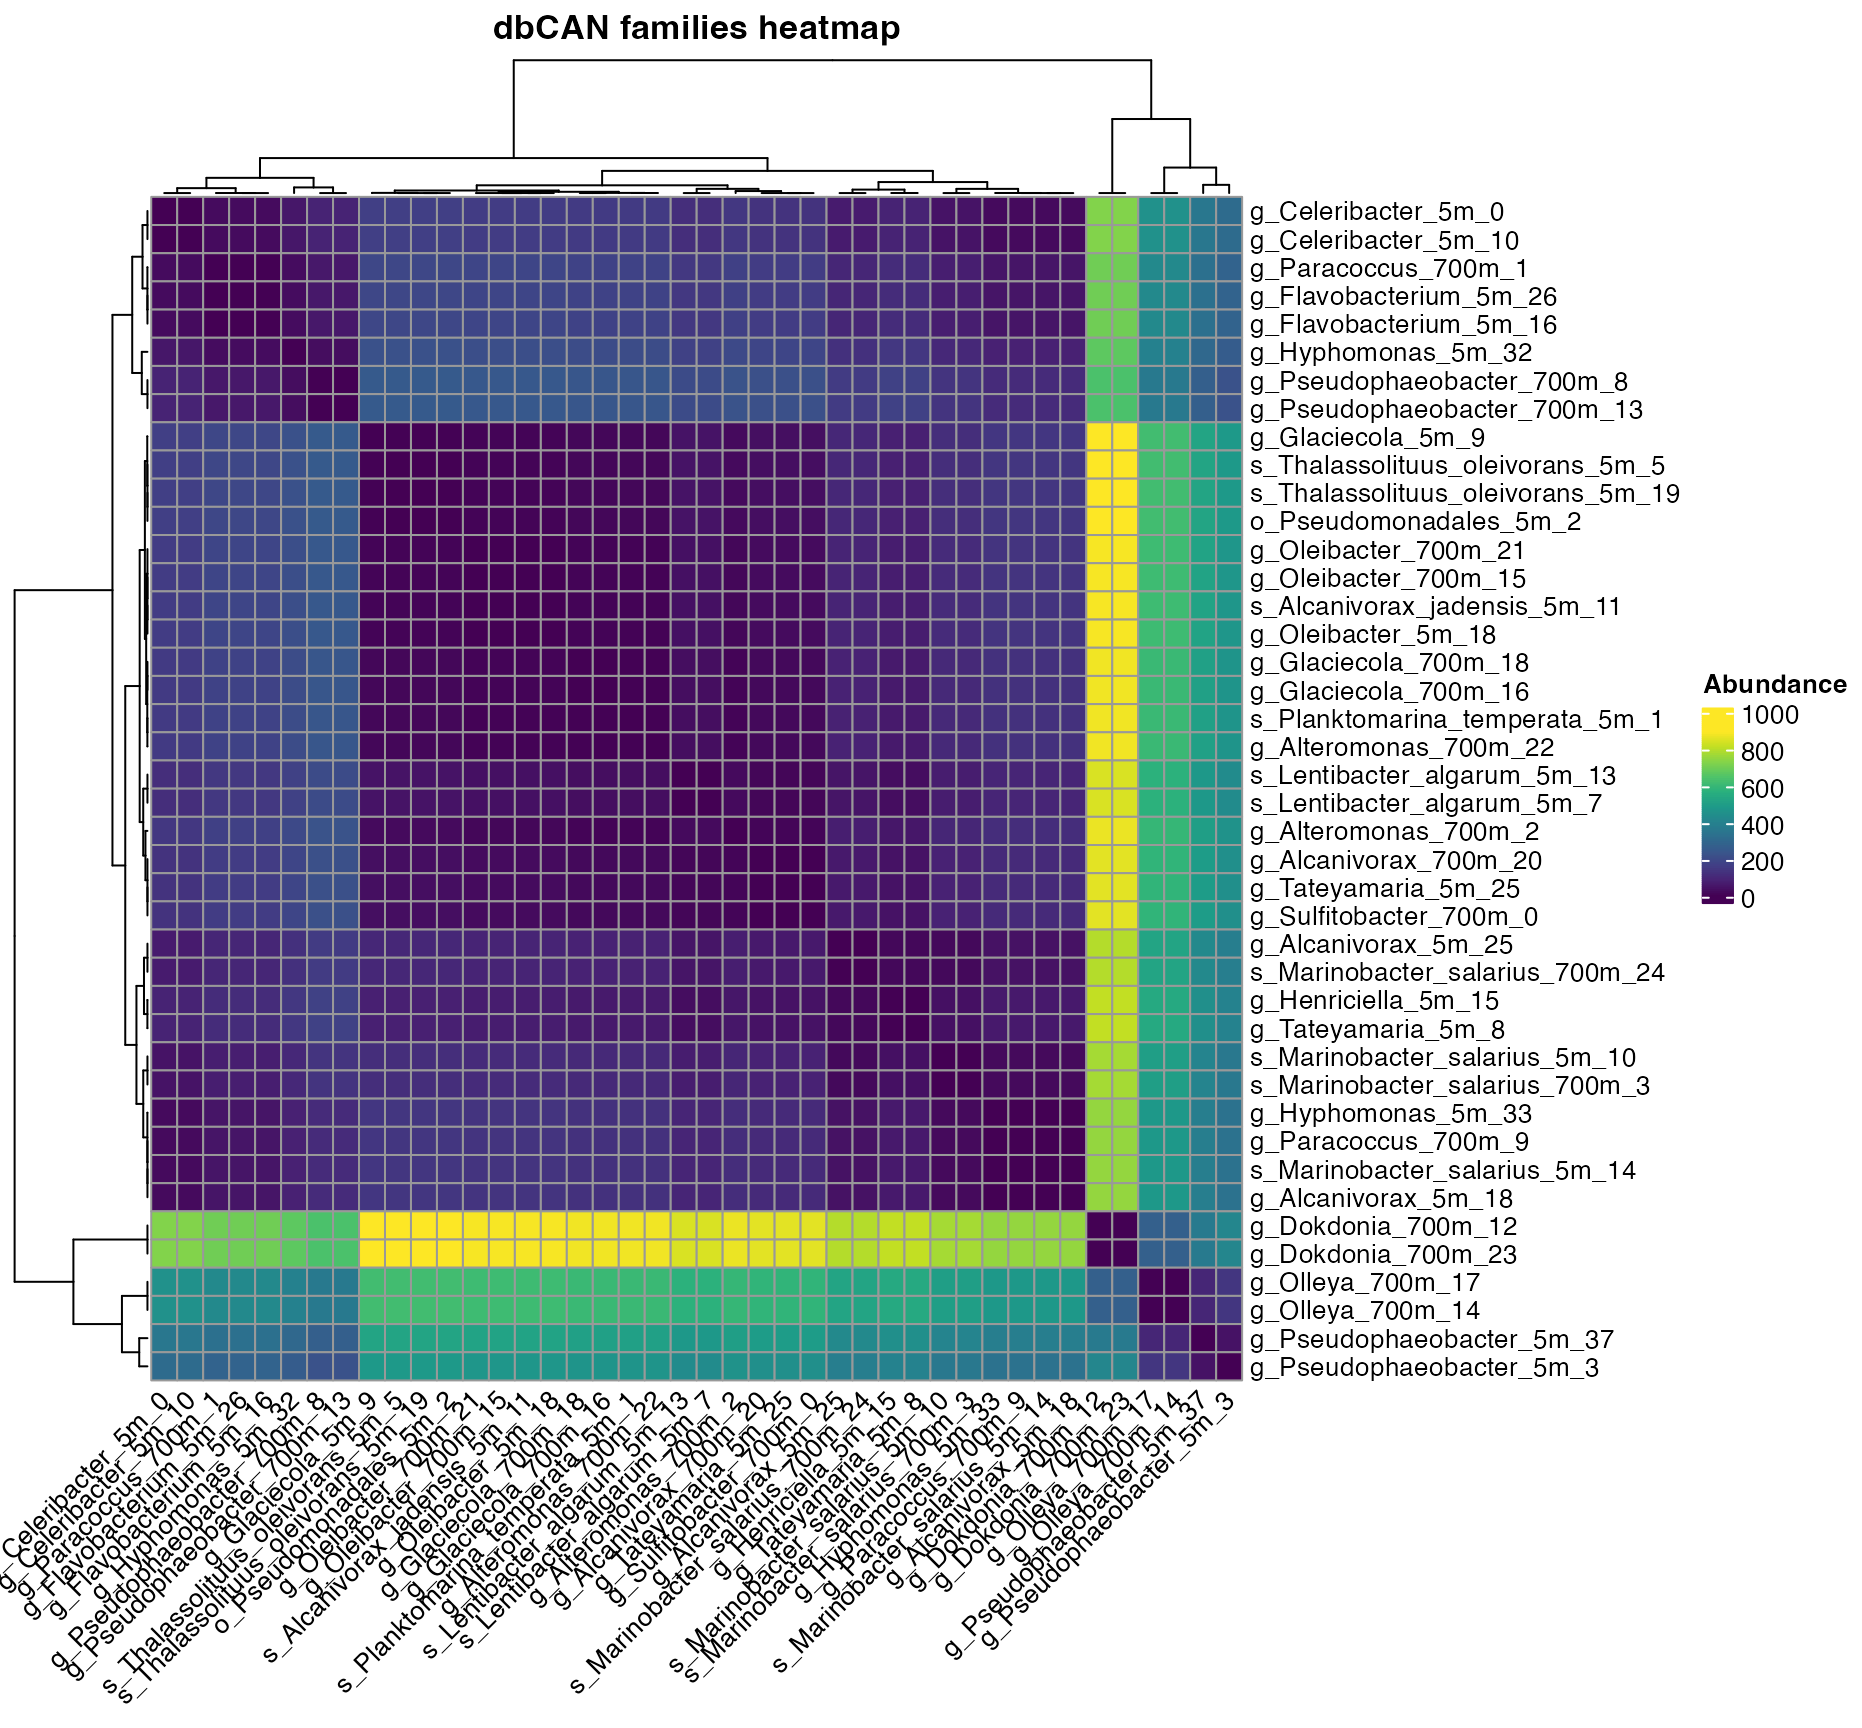
Figure 1. Clustering of dbCAN families across bins.
Use plot_heatmap with the argument
distance = F to visualize the presence/absence of dbCAN
domains across the bins/genome samples.
plot_heatmap(important_dbCAN_FAMs,
             y_axis=dbCAN_family,
             analysis = "dbCAN",
             distance = F)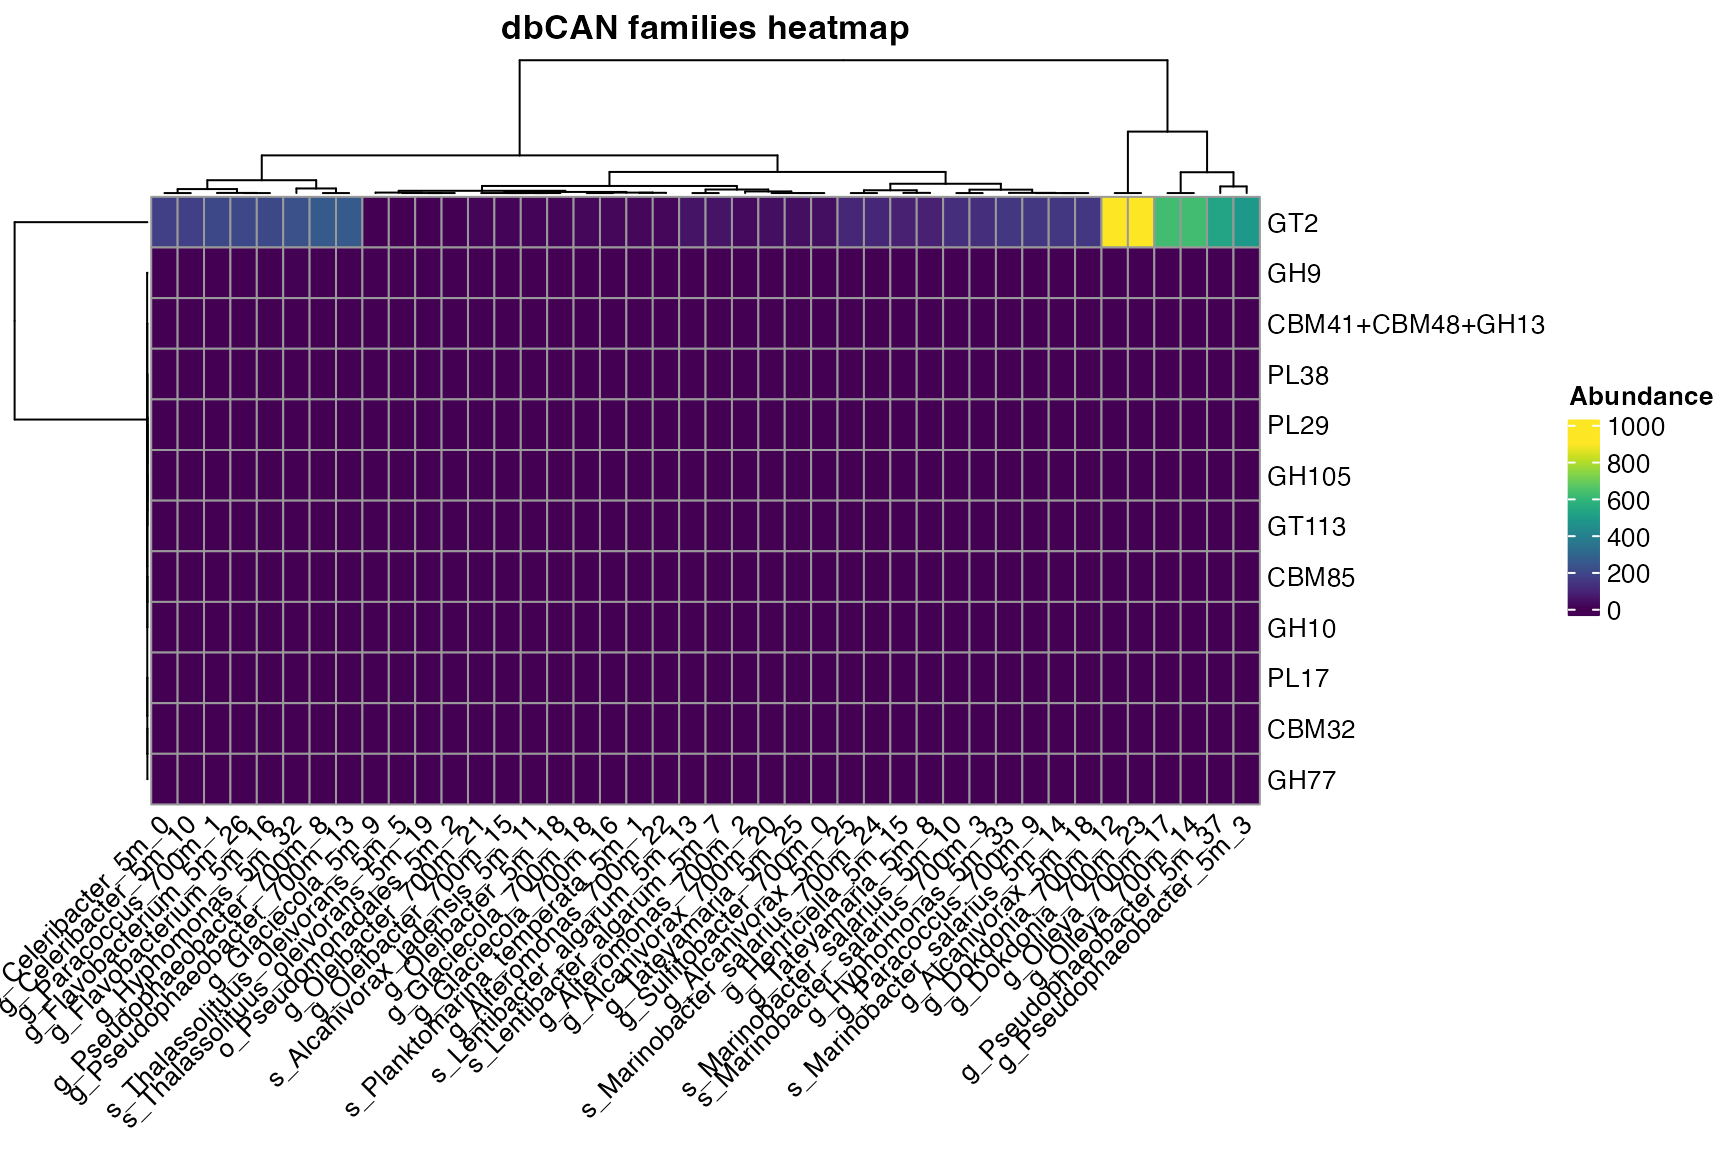
Figure 2. Presence/Absence of dbCAN families across bins.
For plot_bubble, the user has two options for the
argument calc:
- Binary
plot_bubble(important_dbCAN_FAMs,
            y_axis=dbCAN_family,
            x_axis=Bin_name,
            calc = "Binary",
            analysis = "dbCAN",
            data_experiment = metadata_renamed,
            color_character = Depth,
            order_bins = ordered,
            y_labs = "Most contributing dbCAN families",
            text_y = 10,
            x_labs = "Bins",
            text_x = 9)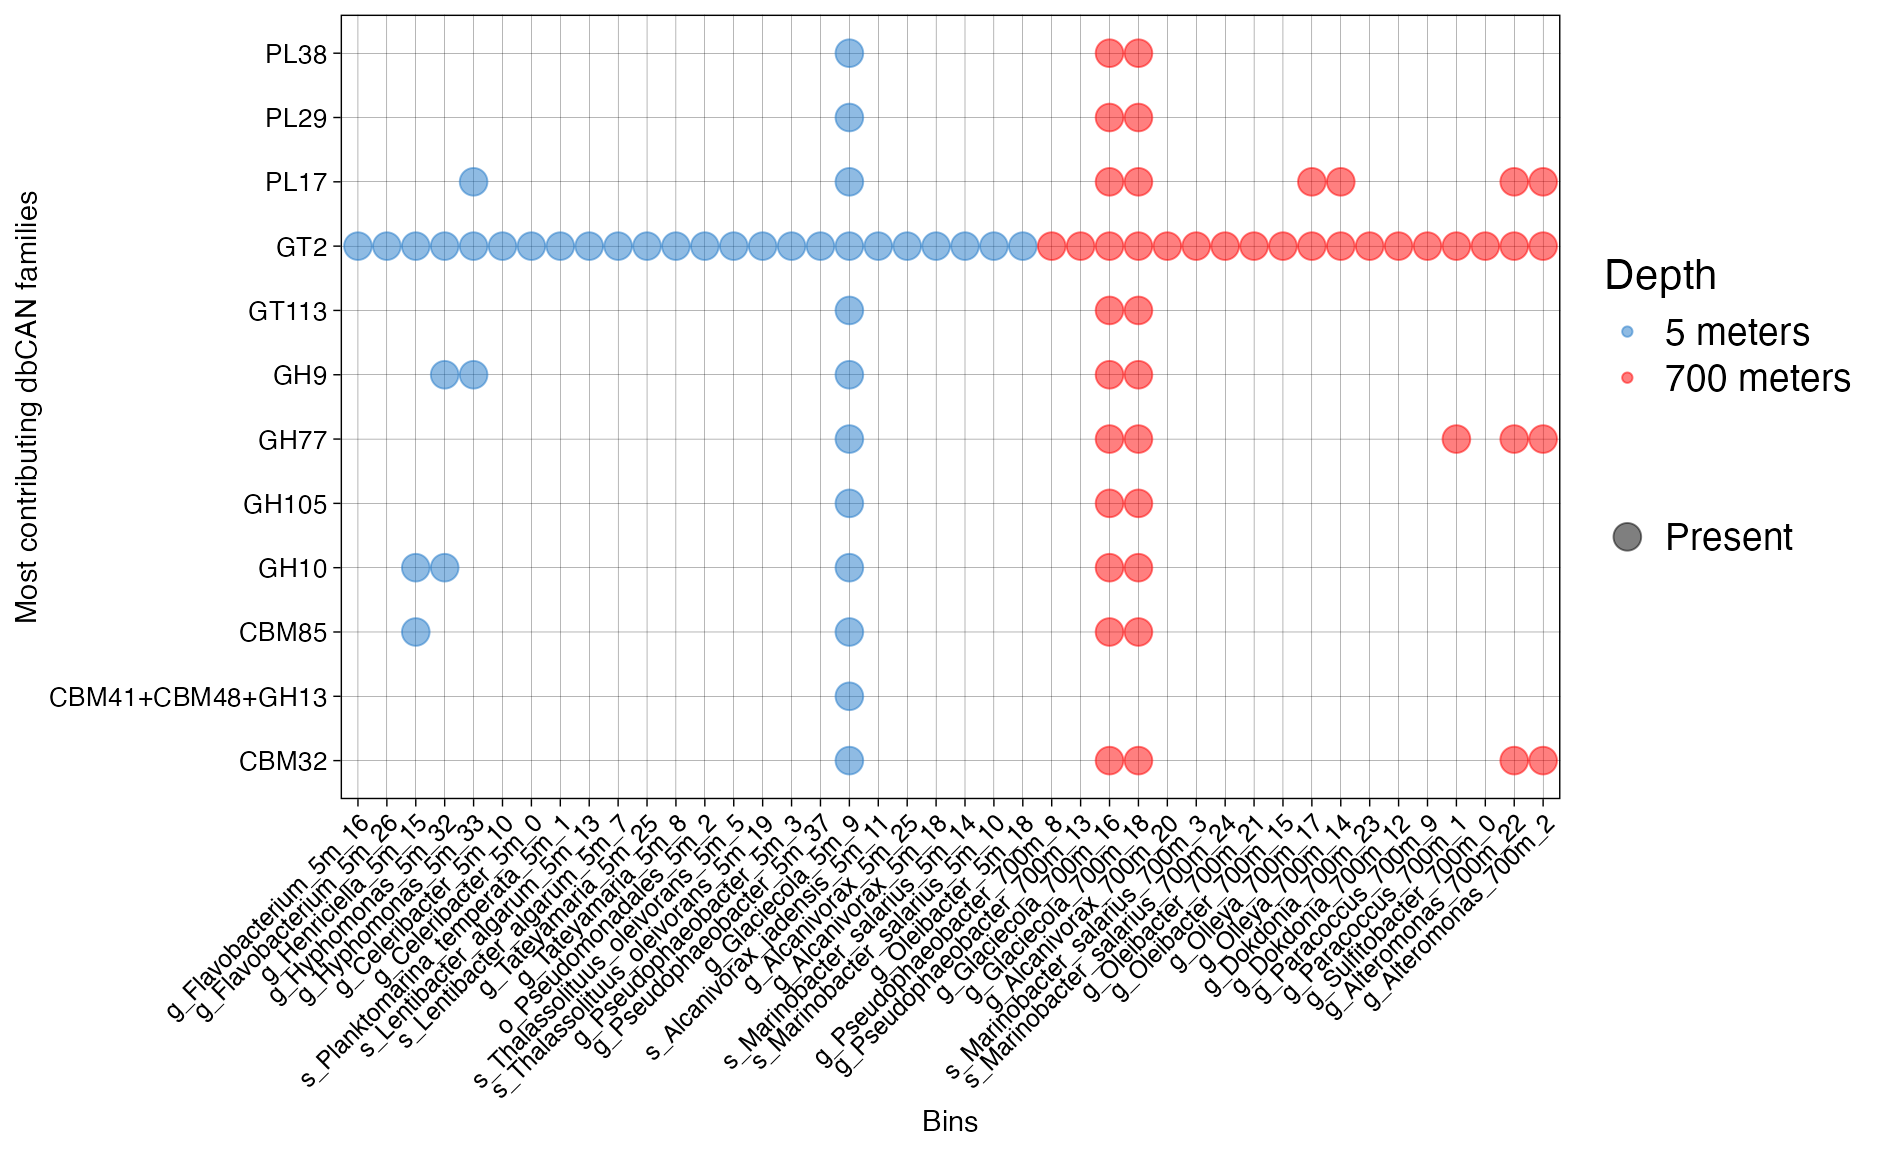
Figure 3. Presence of dbCAN families across bins.
Or
- Abundance
plot_bubble(important_dbCAN_FAMs,
            y_axis=dbCAN_family,
            x_axis=Bin_name,
            calc = "Abundance",
            analysis = "dbCAN",
            data_experiment = metadata_renamed,
            color_character = Class,
            y_labs = "Most contributing dbCAN families",
            text_y = 10,
            x_labs = "Bins",
            text_x = 9,
            range_size = c(1,15))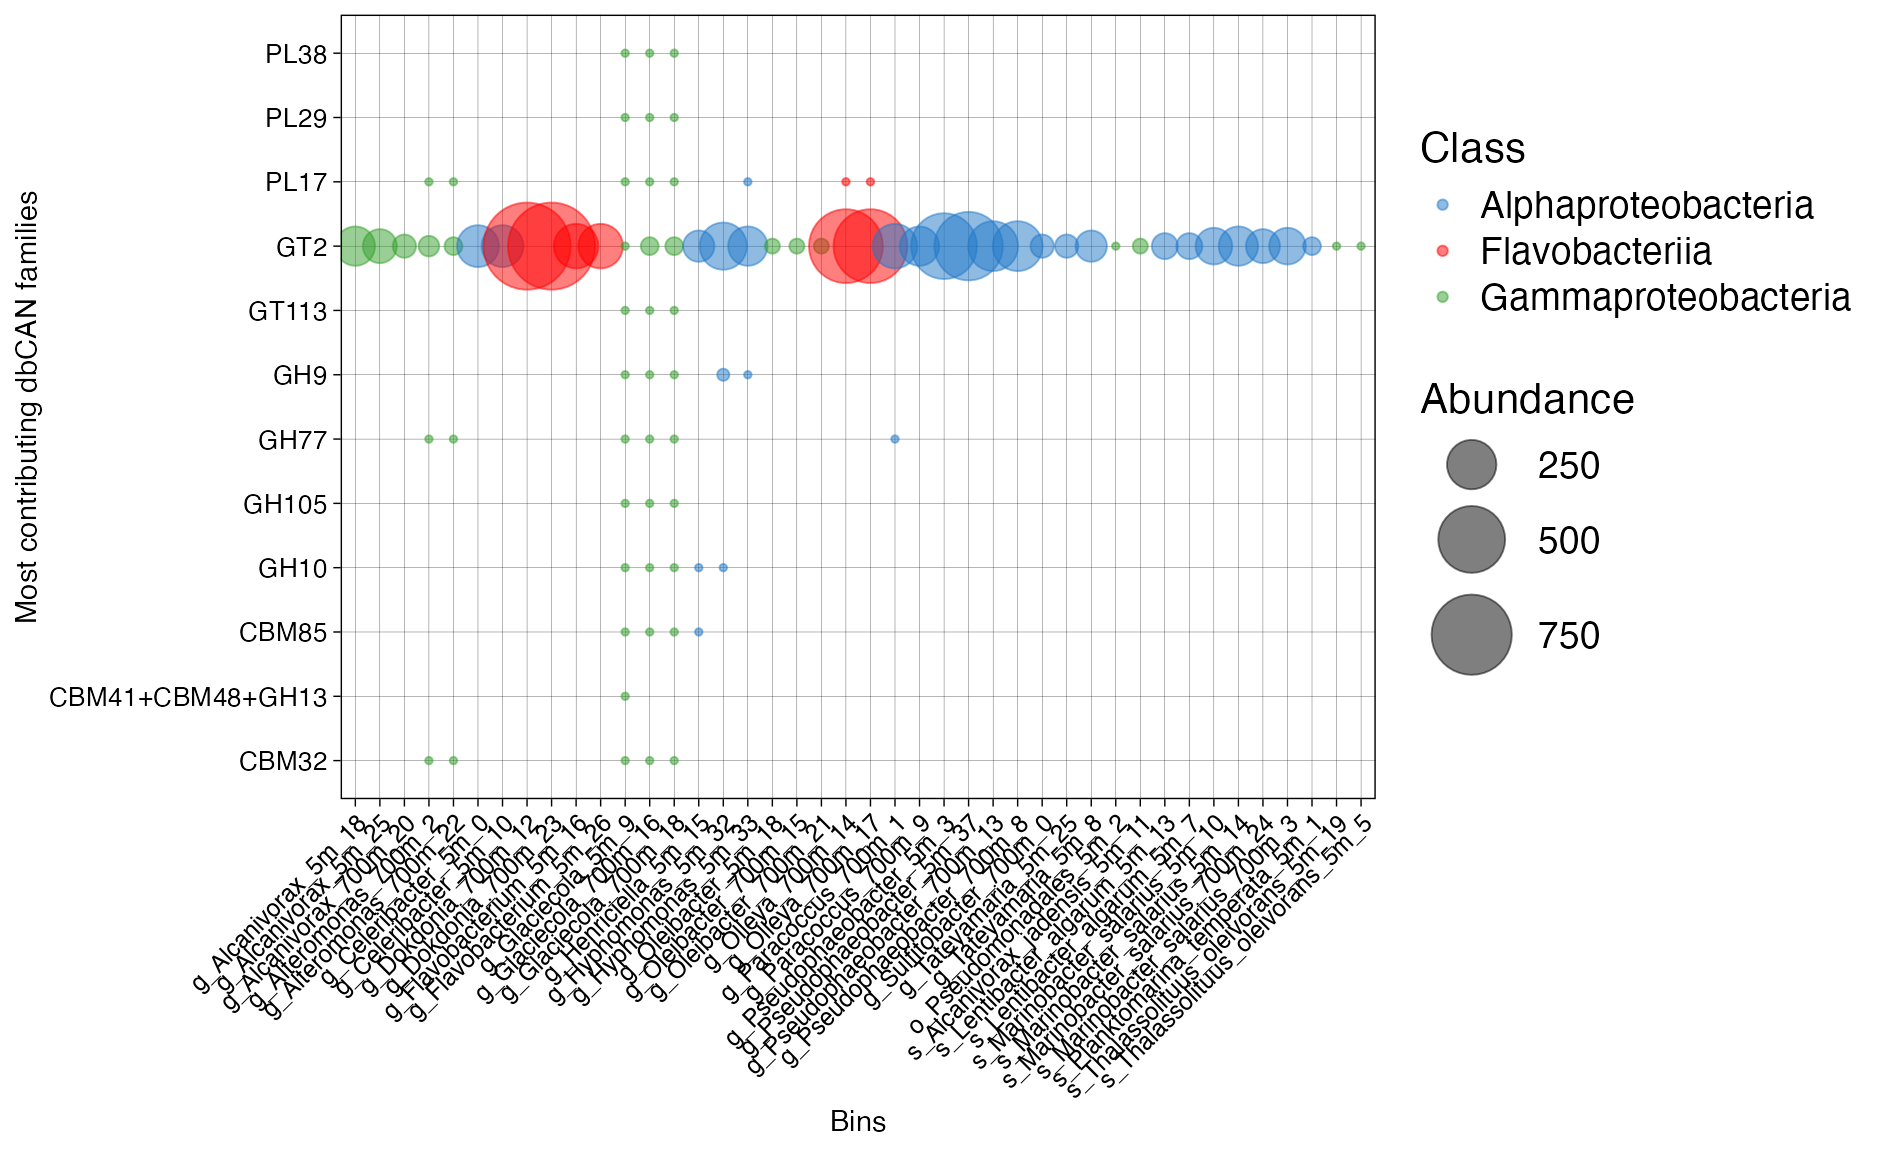
Figure 4. Abundance of dbCAN families across bins.
Note: The order_bins argument was applied to
organize the plot logically by sampling depth, creating a gradient from
the 5-meter surface samples to the 700-meter deep-sea samples.
If you don’t wish to run it like this, omit the argument
order_bins. If not, make sure to run the following:
metadata_renamed <- read_excel("../inst/extdata/metadata_SIPH_renamed.xlsx")

ordered <- c("g_Flavobacterium_5m_16",
             "g_Flavobacterium_5m_26",
             "g_Henriciella_5m_15",
             "g_Hyphomonas_5m_32",
             "g_Hyphomonas_5m_33",
             "g_Celeribacter_5m_10",
             "g_Celeribacter_5m_0",
             "s_Planktomarina_temperata_5m_1",
             "s_Lentibacter_algarum_5m_13",
             "s_Lentibacter_algarum_5m_7",
             "g_Tateyamaria_5m_25",
             "g_Tateyamaria_5m_8",
             "o_Pseudomonadales_5m_2",
             "s_Thalassolituus_oleivorans_5m_5",
             "s_Thalassolituus_oleivorans_5m_19",
             "g_Pseudophaeobacter_5m_3",
             "g_Pseudophaeobacter_5m_37",
             "g_Glaciecola_5m_9",
             "s_Alcanivorax_jadensis_5m_11",
             "g_Alcanivorax_5m_25",
             "g_Alcanivorax_5m_18",
             "s_Marinobacter_salarius_5m_14",
             "s_Marinobacter_salarius_5m_10",
             "g_Oleibacter_5m_18",
             "g_Pseudophaeobacter_700m_8",
             "g_Pseudophaeobacter_700m_13",
             "g_Glaciecola_700m_16",
             "g_Glaciecola_700m_18",
             "g_Alcanivorax_700m_20",
             "s_Marinobacter_salarius_700m_3",
             "s_Marinobacter_salarius_700m_24",
             "g_Oleibacter_700m_21",
             "g_Oleibacter_700m_15",
             "g_Olleya_700m_17",
             "g_Olleya_700m_14",
             "g_Dokdonia_700m_23",
             "g_Dokdonia_700m_12",
             "g_Paracoccus_700m_9",
             "g_Paracoccus_700m_1",
             "g_Sulfitobacter_700m_0",
             "g_Alteromonas_700m_22",
             "g_Alteromonas_700m_2")